Chrome User Experience Report (aka Chrome UX Report, or CrUX) is a web performance metric dataset collected and published by Google.
As Chrome users navigate the web, Google collects performance metrics that describe their browsing experience in terms of rendering speed, page stability, interaction responsiveness (coined as Core Web Vitals metrics, more on that later), alongside other UX signals.
What's great about CrUX?#
Internally, Google uses CrUX site speed data to inform search ranking signals, alongside other factors like page quality, relevance, mobile friendliness and more. You'll also see Core Web Vitals surfaced in Google Search Console and PageSpeed Insights.
At the date of writing, CrUX includes performance metrics for 18+ million websites, making it a valuable resource for anyone working on the web. Here's how you can benefit from it:
- Use Calibre to monitor all your websites at scale. (Get a free 15-day trial).
- Passively observe how users experience your Site, without installing tracking scripts.
- Keep tabs on competitor's websites and see how they compare.
- See performance breakdowns by devices used: Desktop, Tablet or Mobile.
- Check if a site passes Google’s Core Web Vitals, with our Core Web Vitals checker tool.
- View historical web performance trends.
We don’t think so, but: You can see if your sessions are tracked by navigating to chrome://ukm/. Chrome uses RAPPOR to remove Personal Identifiable Information (PII) before sending it to Google.
What metrics does CrUX include?#
Primarily, CrUX reports Core Web Vitals, alongside other important metrics that can be used to learn more about your site's audience and their overall user experience.
Core Web Vitals#
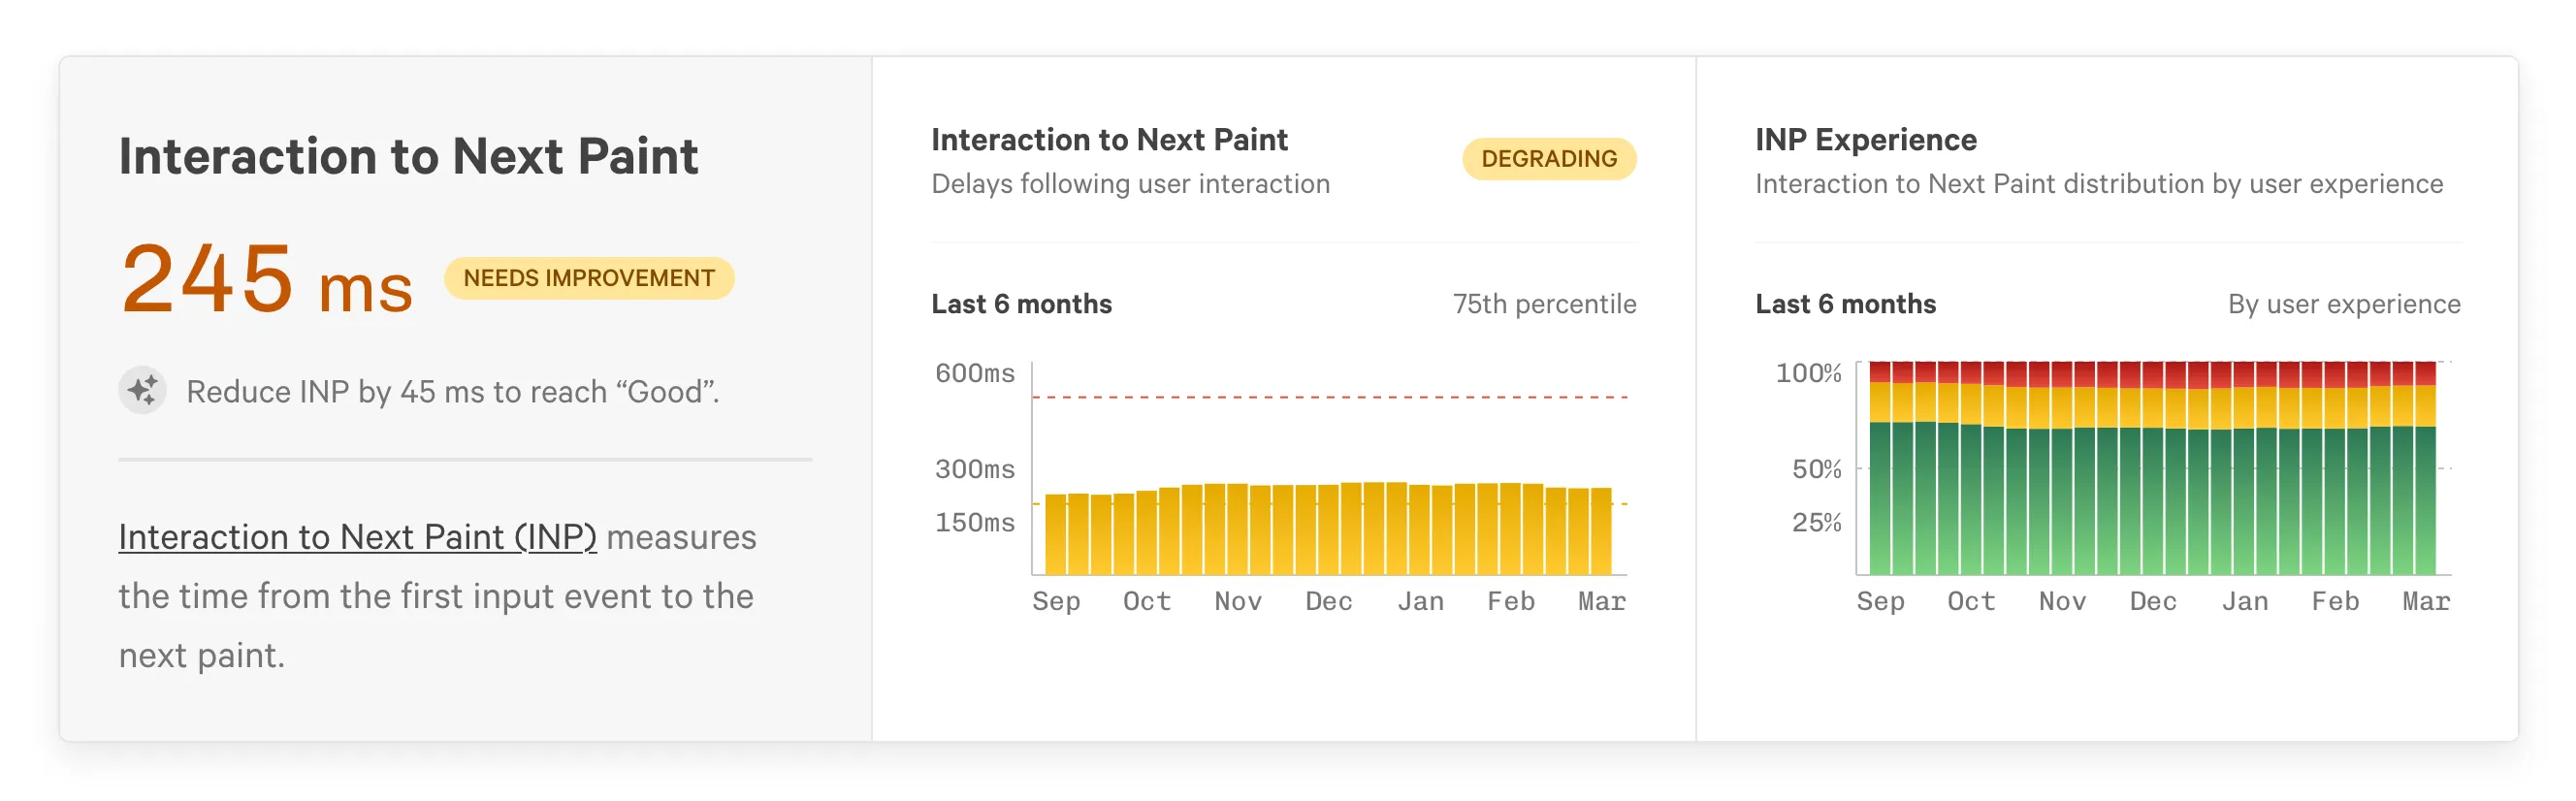
Core Web Vitals are the gold standard for measuring site speed on the web: Largest Contentful Paint (LCP), Cumulative Layout Shift (CLS) and Interaction to Next Paint (INP).
Each metric comes with a recommendation for what Google states is acceptable for users.
| Core Web Vital metric | What does it measure? | Required value |
|---|---|---|
| Largest Contentful Paint | When the largest <img>, <video> or image appears. | < 2.5 seconds |
| Cumulative Layout Shift | Page instability and content shifts. | < 0.1 |
| Interaction to Next Paint | Visual delays following user interaction (clicks, taps, etc.). | < 200ms |
In order for your site to pass Google’s site speed assessment for search ranking, all three Core Web Vitals metrics must meet the recommended values for 75th percentile of visitors.
Taking Largest Contentful Paint as an example, if you have 100 people visit your website, LCP should be 2.5 seconds or less for 75 of them.
Other important metrics included in CrUX#
Important UX signals like Time to First Byte (TTFB), First Contentful Paint (FCP) and Round Trip Time (RTT) all have a role to play in describing user experience on websites.
While these metrics aren't considered Core Web Vitals, they provide key insights to user-experience, so it’s important to understand how to interpret them.
Full historical data is available for all metrics, so you can see how a Website or URL changes over time:
What is the fastest way to check Chrome User Experience Report data?#
There are a multitude of ways to view CrUX data, but the easiest and most efficient way is to use our free Core Web Vitals checker tool.
How does Calibre use CrUX data?#
Calibre monitoring leverages CrUX data, including Core Web Vitals as part of it’s pro subscription, and free tools:
- CrUX Dashboard monitors origin data for your website.
- CrUX Metric Report provides a detailed view of each Core Web Vitals metrics.
- CrUX Pages automatically discovers and monitors the most important pages on your website.
- Core Web Vitals Test, a free tool for checking any URL.
- Website Speed Leaderboard ranks the world's top sites by category for Core Web Vitals performance.

How do I collect data from CrUX directly?#
You can directly access CrUX data for free (with usage restrictions), using APIs or Google BigQuery.
JSON APIs#
APIs provide a subset CrUX data in two different modes: Current aggregations (last 28 days), or History (aggregated by week, with up to 40 weeks of history). APIs require an API key and are limited to 150 requests/second, so careful query coordination is required for large batches of URLs.
Both the current and history API allow you to query metrics for an origin (e.g.: all pages on example.com aggregated together) or an individual url (e.g.: example.com/home).
curl -X POST 'https://chromeuxreport.googleapis.com/v1/records:queryRecord?key=API_KEY' \
    --header 'Accept: application/json' \
    --header 'Content-Type: application/json' \
    --data '{"origin":"https://www.example.com"}'
curl -X POST 'https://chromeuxreport.googleapis.com/v1/records:queryHistoryRecord?key=API_KEY' \
--header 'Accept: application/json' \
--header 'Content-Type: application/json' \
--data '{"origin":"https://www.example.com"}'BigQuery#
Google BigQuery is a large analytics database product, offered as part of Google Cloud. BigQuery uses variant of SQL in order to provide data access.
CrUX data is published in a few different data formats and slices:
- World wide origin data, including all device types.
- Grouped by country.
- Grouped by device type (e.g.: Desktop, Tablet, Phone).
- Monthly aggregate data going back to October 2017.
BigQuery is billed based on the data usage of your queries. Extensive or unoptimised queries can result in a large bill on your Google Cloud account. Proceed with caution!
BigQuery has a steep learning curve and requires knowledge of Google Cloud & SQL, so it’s best used when you specifically need country-level data, or want to access data for multiple origins at once.
Our favourite way to access BigQuery is to avoid querying it directly, instead opting for a local database tool like DuckDB with bigquery plugin which can be used to remotely query data from BigQuery, staging data in local tables for later analysis and manipulation.
DuckDB is an in-memory or flat file database. It excels at collecting and publishing data to and from various formats, like BigQuery, HTTP, JSON, CSV, Postgres, Iceberg and many more.
CREATE TABLE au_top_1000 AS SELECT * FROM bigquery_query('GCP_PROJECT_ID', 'SELECT distinct
	country_code,
	origin,
	experimental.popularity.rank
FROM `chrome-ux-report.experimental.country`
WHERE yyyymm = 202503
AND experimental.popularity.rank <= 1000
AND country_code = "au"
GROUP BY country_code, origin, experimental.popularity.rank
ORDER BY country_code, experimental.popularity.rank');
The query above creates a local duckdb table called au_top_1000, and copies in the Australian Top 1000 website URLs.
Why is my website not included in CrUX?#
In order for your website to be included in the CrUX dataset, it must be popular to generate enough traffic to meet Google’s anonymity requirements, so that users can't be easily tracked.
To date, Google has not directly specified a number for how many visits are required each month, but we suspect it to be at least a few thousand visits per month.
If your website isn't included in CrUX, you will likely see an error of "the chrome user experience report does not have sufficient real-world speed data for this page". The CrUX API will return a 404 if your URL isn't present in the dataset.
If your site has no CrUX data, it’s worthwhile to review the following checklist:
- Is the URL free of redirects? Are you using the canonical URL? e.g. example.com vs www.example.com.
- Do your pages return a successful HTTP status, like
200 OK? - Are your pages blocked by
robots.txt,<meta name="robots" content="noindex">tags orX-Robots-TagHTTP headers?
If those conditions are met and your pages are still not included, then you may want to consider evaluating page performance with synthetic tests and continue to increase the number of page visits to your website.
In review#
- Chrome User Experience Report (CrUX) includes data from Google Chrome sessions for users who are logged in to Chrome.
- CrUX does not include sessions from Chrome on iOS. Apple disallows use of non-Webkit browser engines on iOS devices.
- Your site needs to be indexable and "sufficiently popular" to appear in CrUX.
- CrUX is just one of several site speed ranking signals. Google wants to incentivise site owners to offer superior experiences to users.
If you'd like to use CrUX but aren't quite ready to dive into the world of APIs or SQL, we recommend signing up to Calibre (make use of our free 15-day trial!).
With Calibre, you can passively monitor all your websites with minimal effort and focus on what you do best. Build great websites.