Getting Started with Calibre
Getting to know new tools can feel daunting, which is why we created this guide to help you get started and be successful in establishing a site speed monitoring system. You can always explore all features or contact our friendly support team if you have any questions.
Step 1: Add your Sites to Calibre
To add a Site, choose one of 17 global test locations, add a name, provide a URL to be tested, set a testing schedule and assign it to a Team. Calibre allows you to monitor unlimited sites and pages, without any extra cost.
After creating the Site, you can configure Test Profiles, add Pages to test, connect to Slack, GitHub and more.

The initial synthetic test runs three consecutive Snapshots to provide the most reliable results. We will email you when results are ready. After adding a Site, you can check the real user data in the CrUX Dashboard immediately.
Step 2: Configure test environments
After adding Sites and pages to track, it’s time to choose the conditions for testing. Test Profiles allow you to set up a combination of testing scenarios that cover a wide range of user experiences.
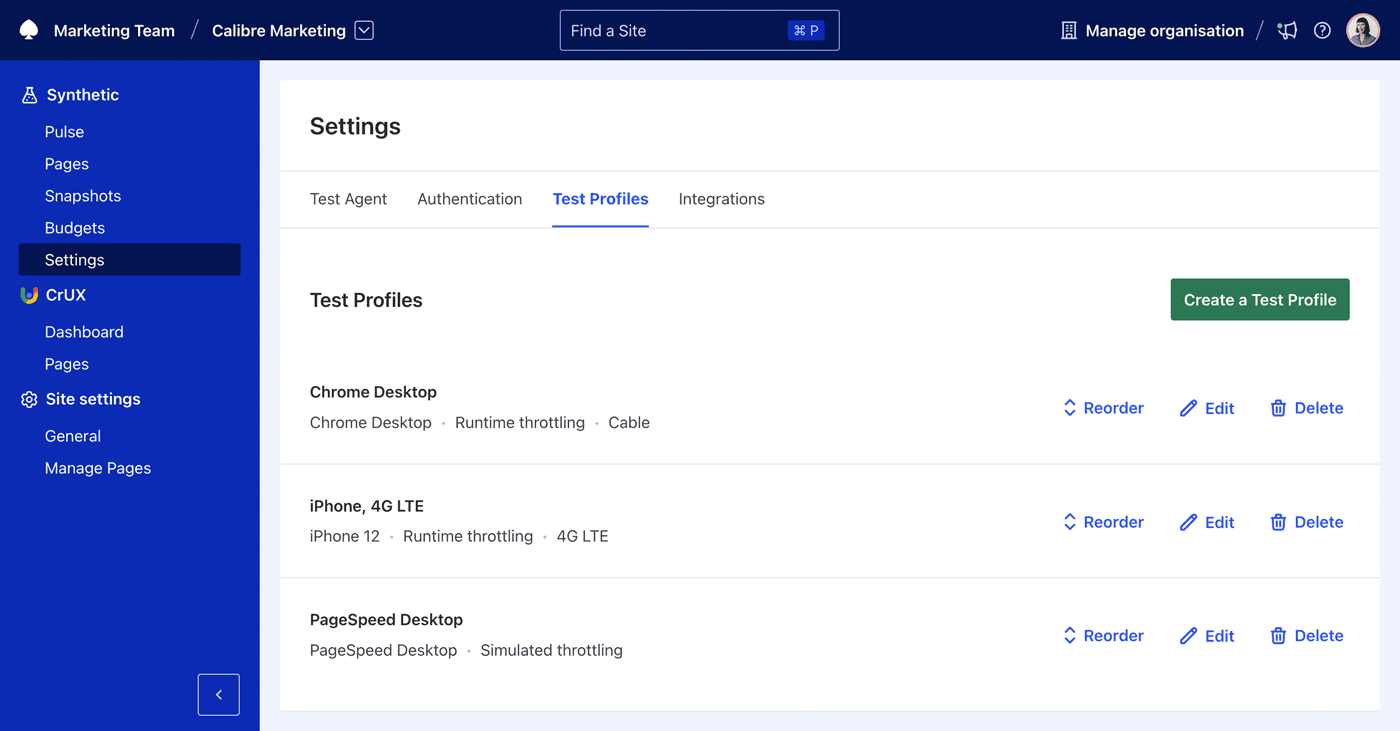
You can emulate devices, network speeds, authenticate into your applications, turn off ads or specific third party vendors. Calibre will automatically create three baseline Test Profiles for you:
- Chrome Desktop with a Cable connection
- Motorola Moto G4 with a regular 3G connection
- iPhone with a 4G LTE connection
These three Test Profiles show an accurate portrayal of the speed spectrum, based on global averages. Mix and match settings to create comprehensive user testing scenarios relevant to your audience. We recommend turning off ads and testing without third parties.
Step 3: Set Performance Budgets
Budgets are a great way of making sure that when the speed of your Sites deteriorates, you are instantly notified and can act on regressions. Set budgets against any metric available in Calibre and apply them to specific pages and Test Profiles.
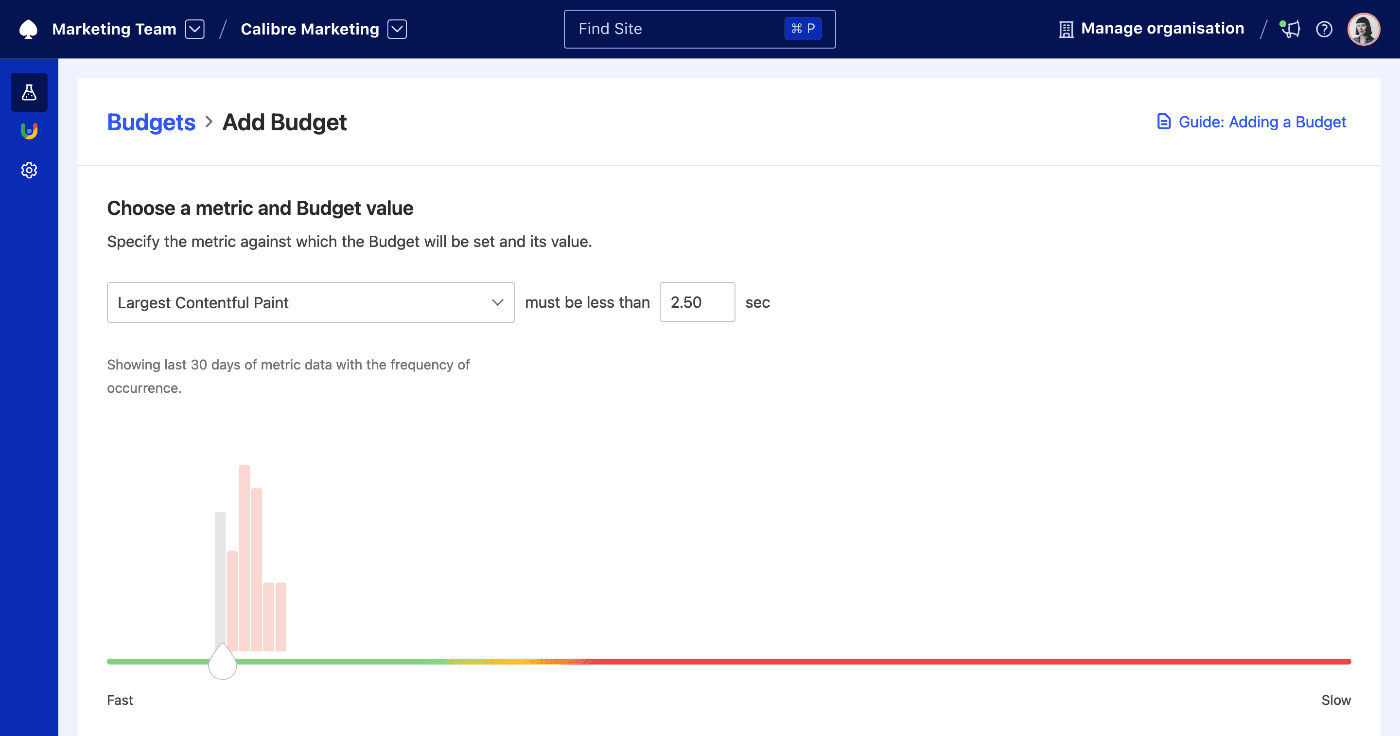
You can be notified when a budget is met, exceeded or at risk in two ways: through email or Slack alert posted to a chosen channel.
It’s a great idea to create a dedicated a general #speed-metrics channel or a dedicated #projectName-alerts channel so your team can keep an eye on speed improvements and regressions.

We recommend starting with setting budgets against several metrics that describe user experience most accurately, such as:
- Largest Contentful Paint
- Cumulative Layout Shift
- Total Blocking Time
- First Contentful Paint
- Total JavaScript Transferred
- Time to First Byte
- Total Third Party Code Transferred
Step 4: Set up Pull Request Reviews
A majority of speed regressions are preventable using pre-production monitoring. With Pull Request Reviews, you’re will see the speed impact of your work before it affects your customers.
Each review will showcase changes to critical Web Vitals metrics: Largest Contentful Paint, Cumulative Layout Shift and Total Blocking Time. It will also highlight changes in assets transferred and performance budgets.
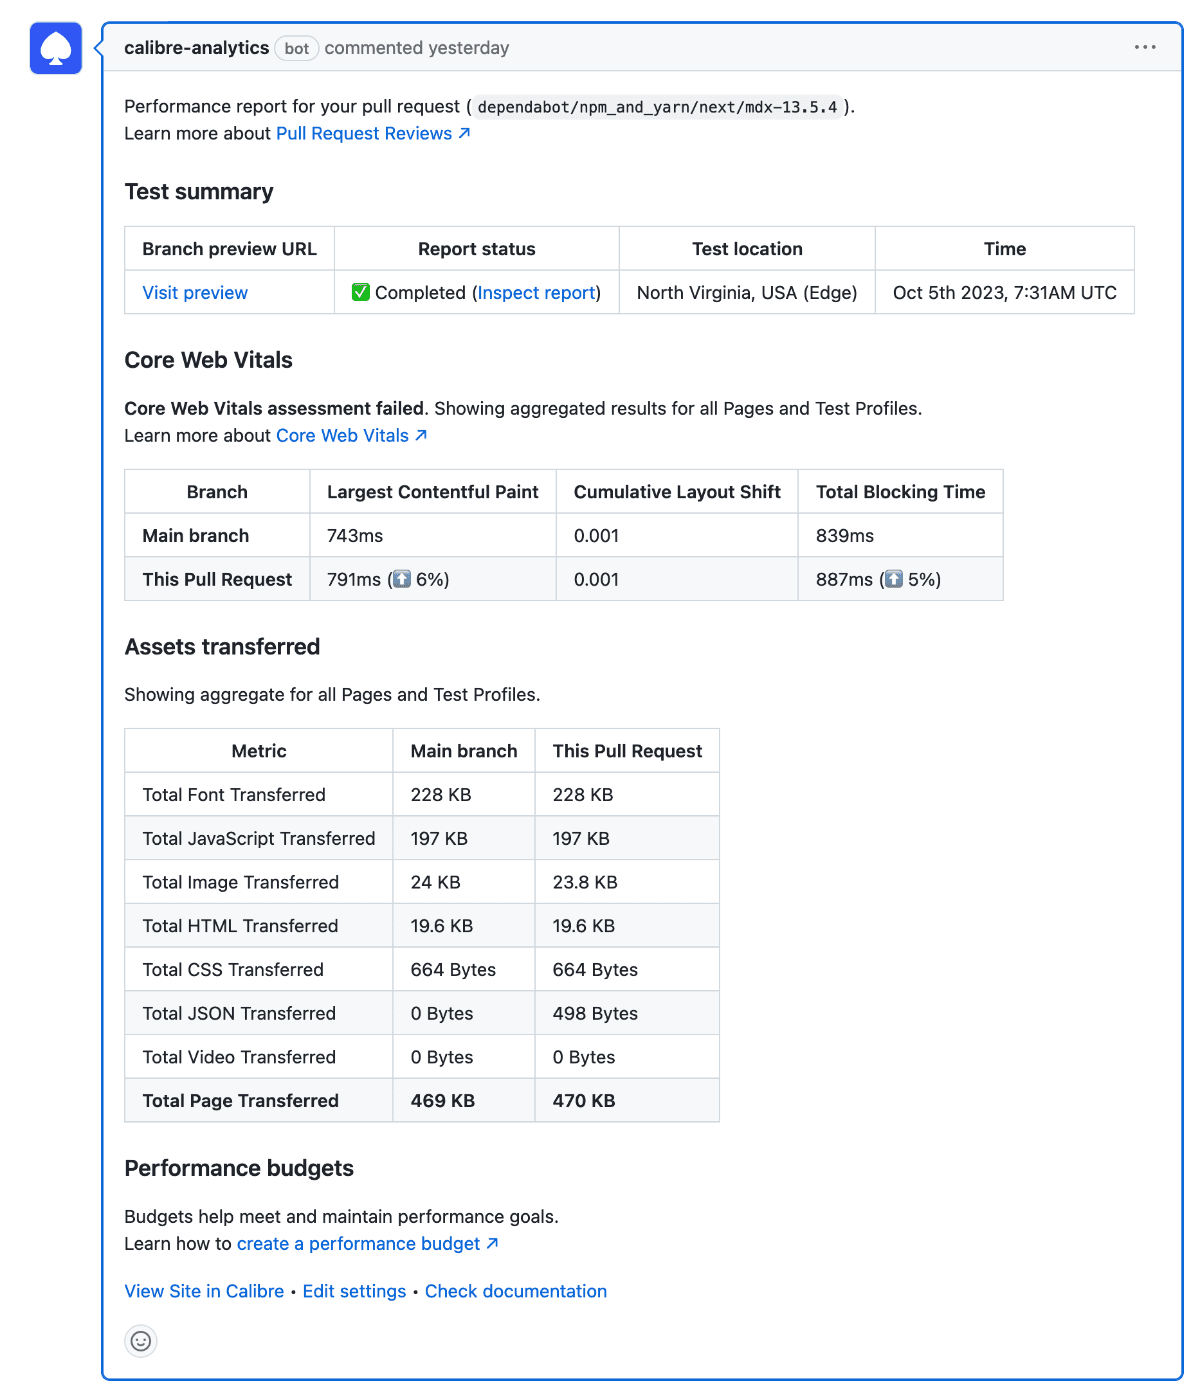
A comprehensive comparison of your production (or staging) environment and the changes made in the Pull Request will be posted as a comment, accessible to anyone using GitHub. You can enable Pull Request Reviews for any selected Site.
To use Pull Request Reviews, you need to be using GitHub and one of the supported deployment methods, such as Vercel, Netlify, Heroku or GitHub deployment statuses.
Step 5: View the results
Synthetic tests
There are several ways to view synthetic speed data in Calibre. First one is the Pulse page, showcasing historical metric data trends across Test Profiles, including markers for when deploys happened. Metric graphs can be reordered and explored to investigate 6, 3, 1 month and 7-day averages.
Snapshot Overview provides the most speed information:
- critical speed metrics (color-coded based on good, need improvement or poor readings)
- a render timeline
- a JavaScript Long Task Timeline
- assets transferred by type graph
- request table
You can view a render video of your Site and inspect the stages of rendering in a timeline, which helps with grading what your users experience. With the Long Task Timeline, it’s possible to pinpoint long-running and blocking JavaScript tasks. Lastly, assets and requests can be inspected in great detail to find speed bottlenecks.
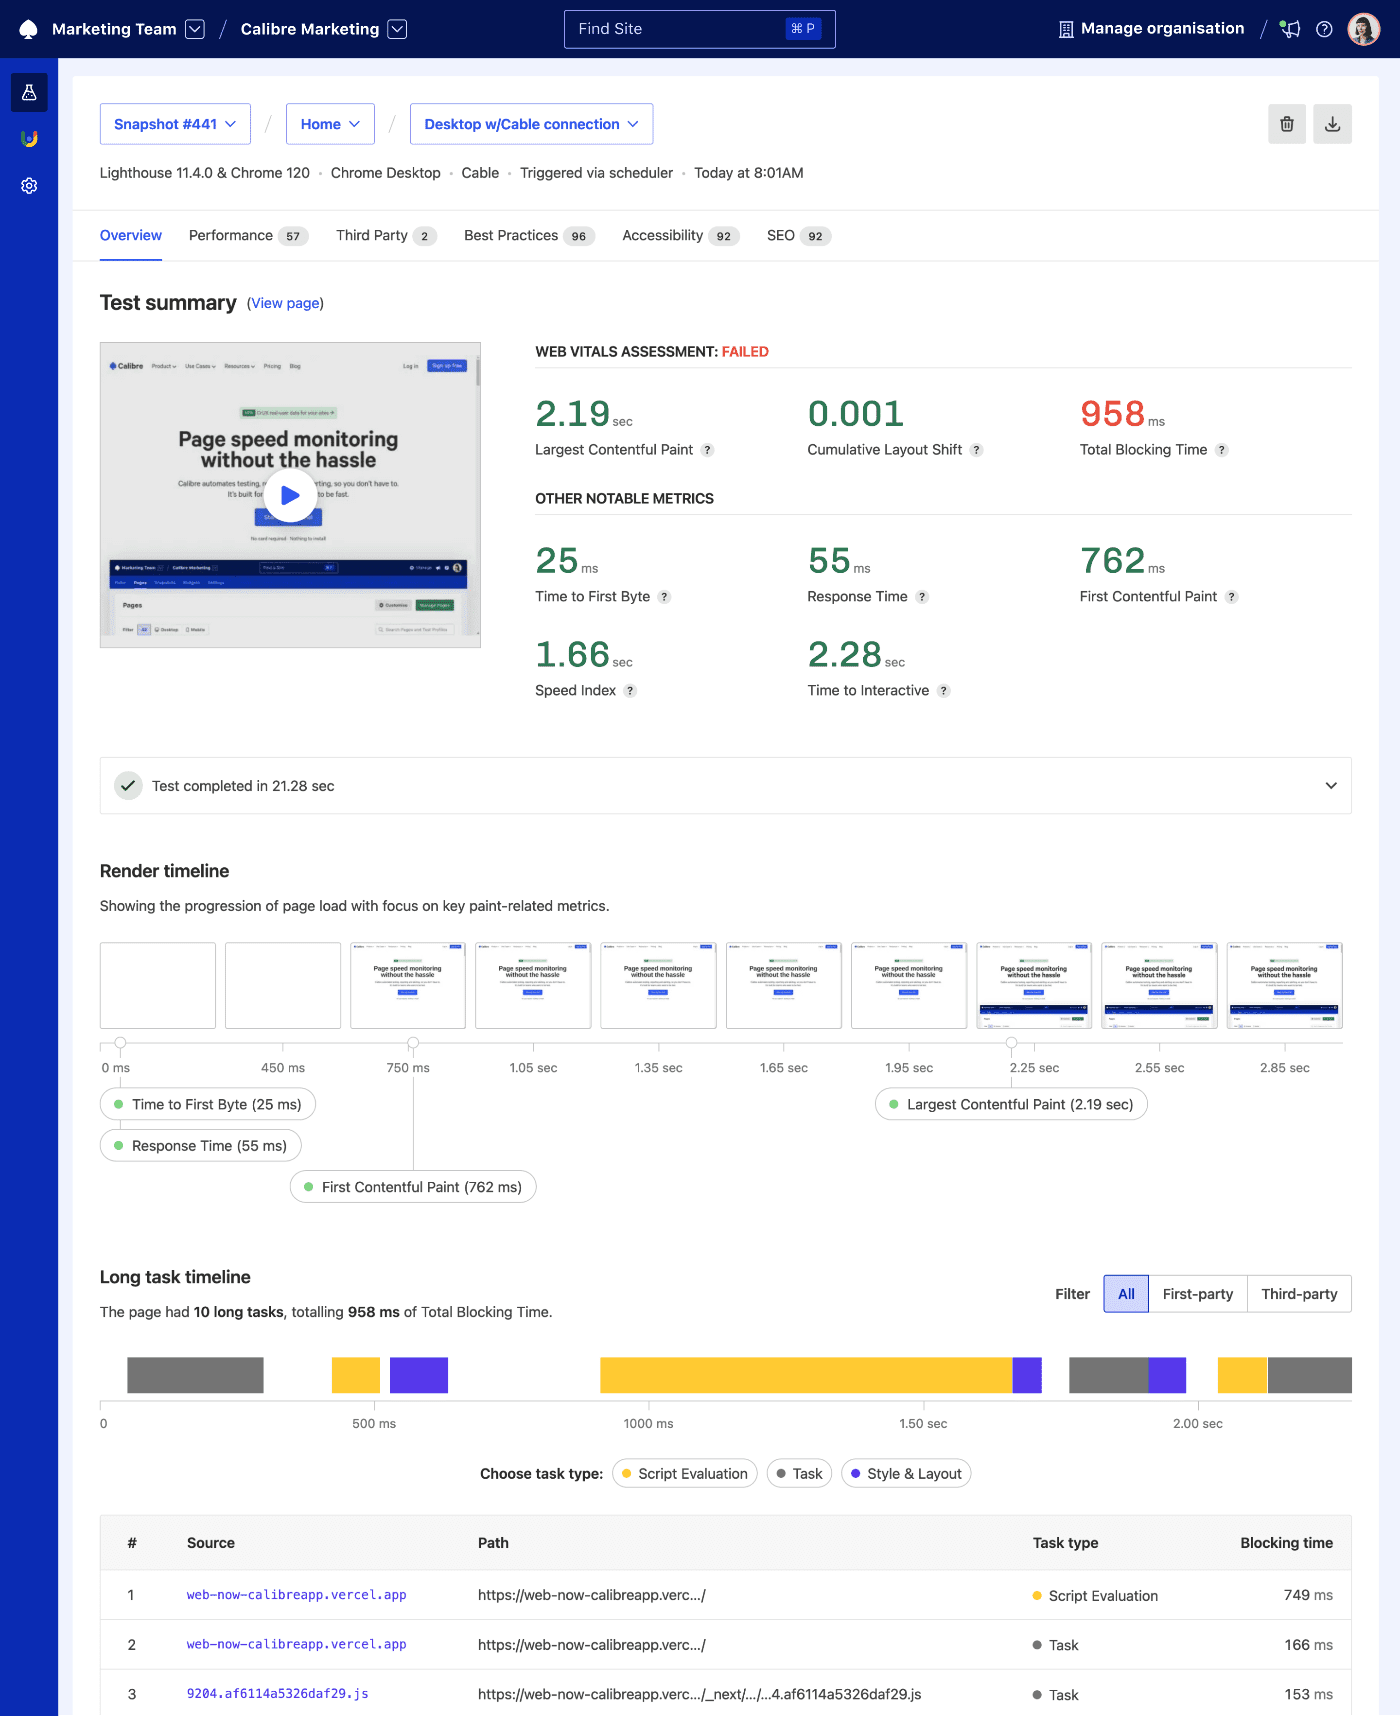
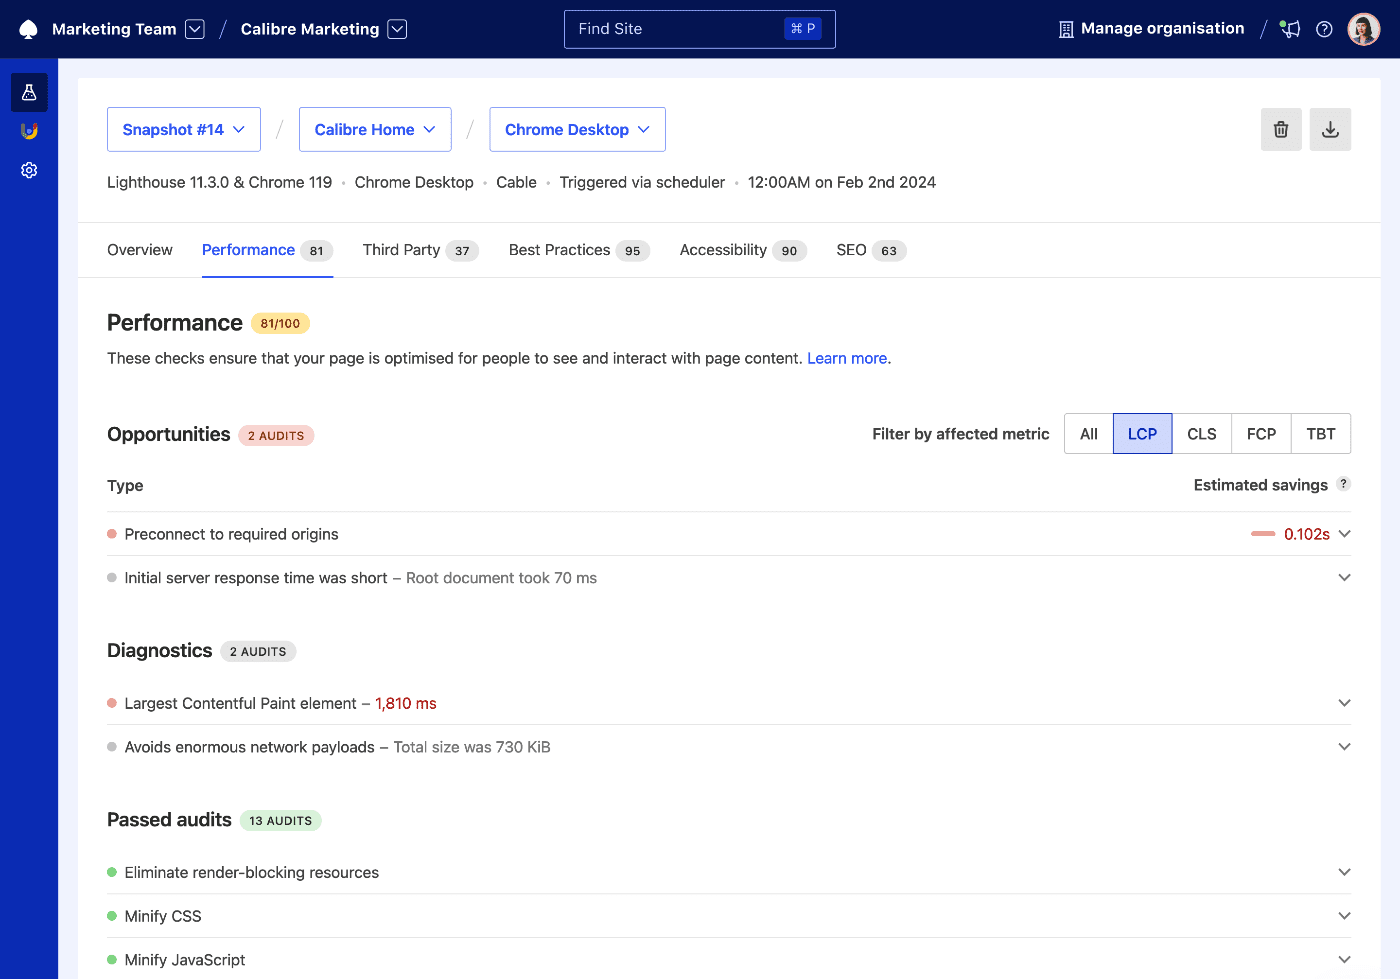
Performance, SEO, Best Practices, and Accessibility tabs provide information about passed and failed Lighthouse audits, highlighting opportunities for improvement.
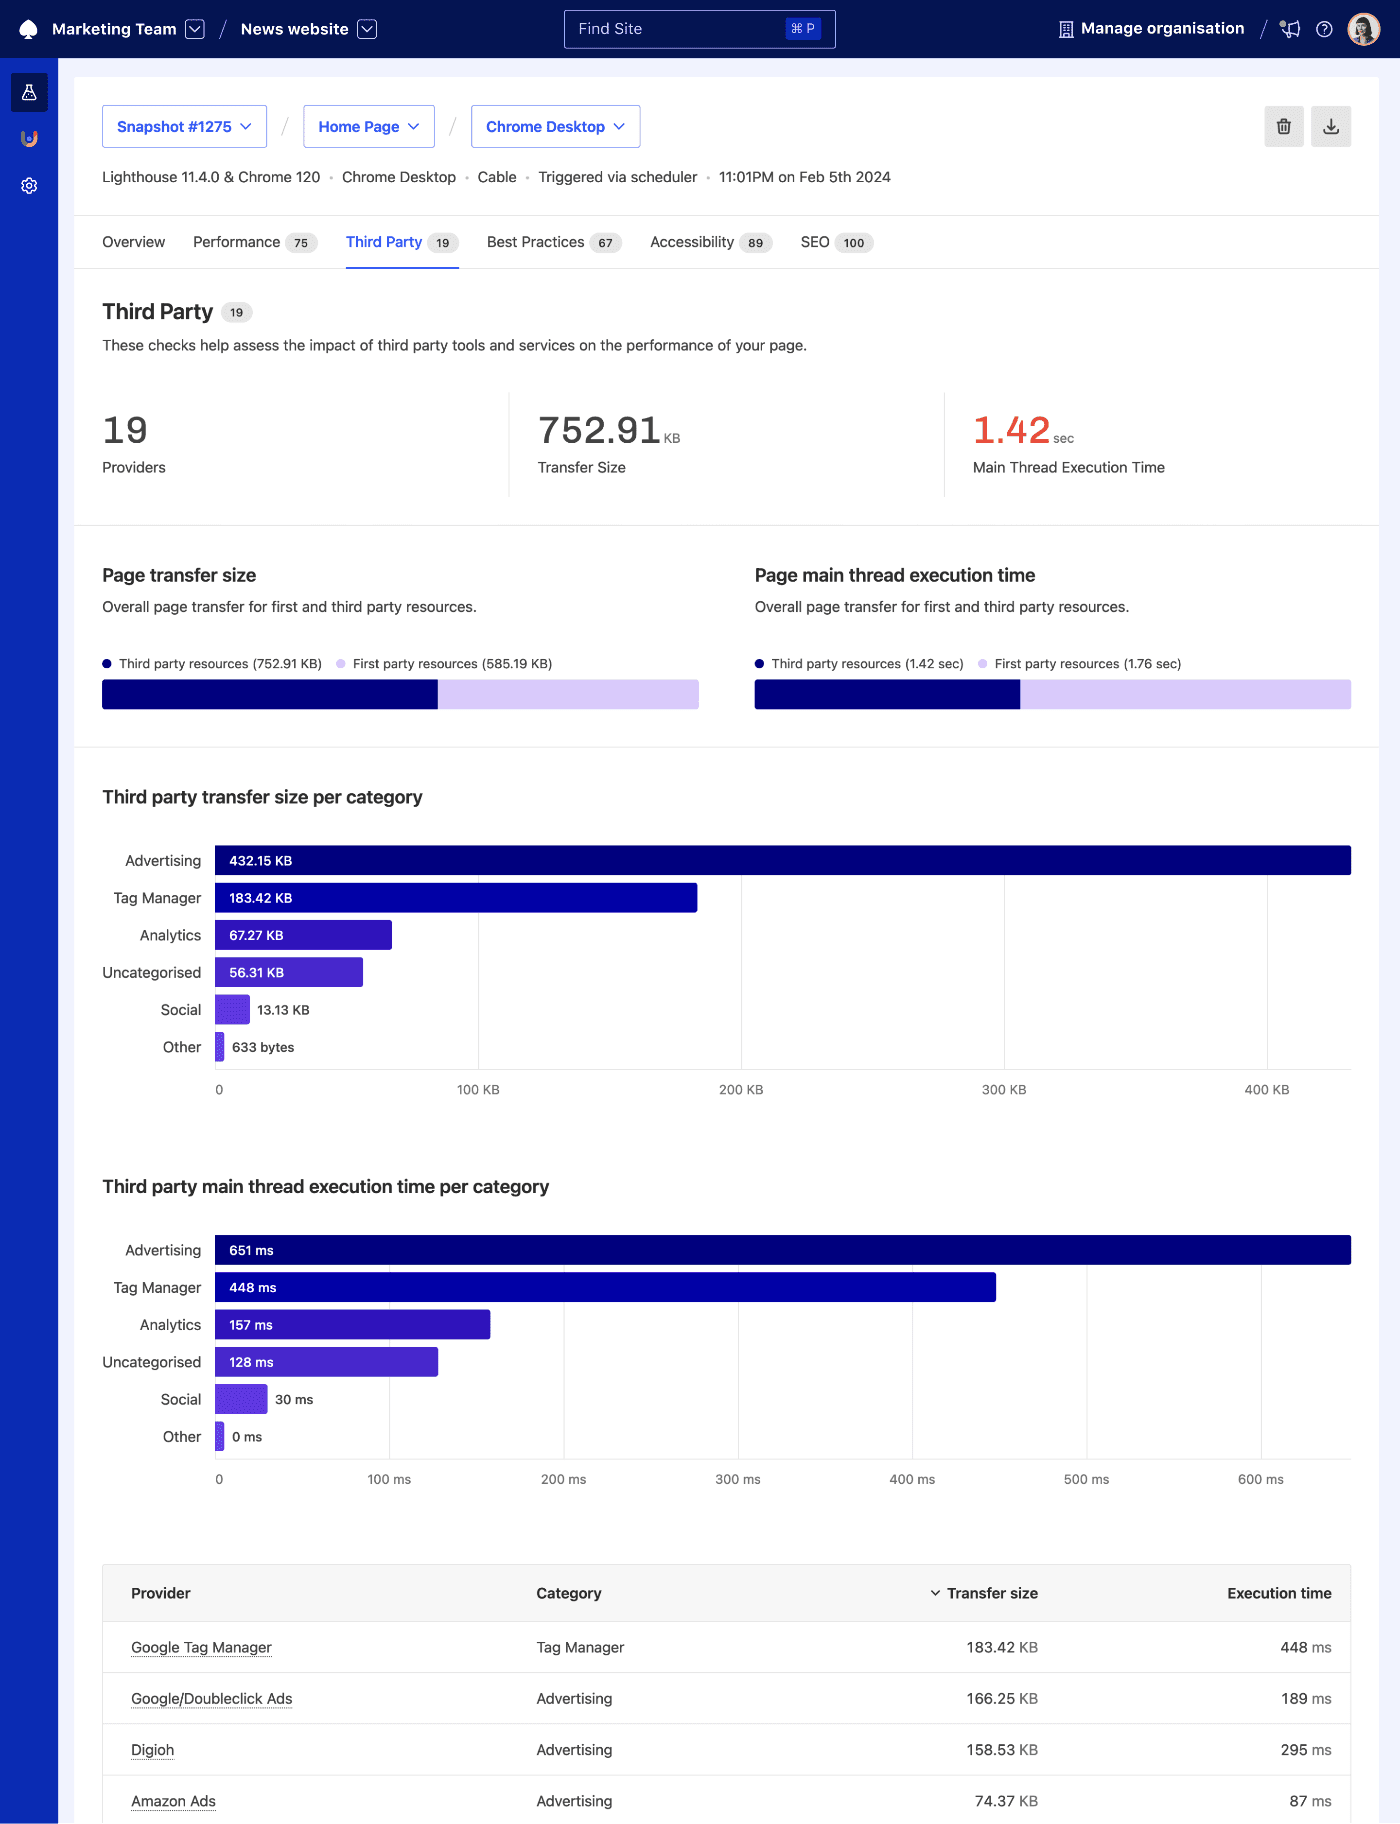
The Third Party tab provides insight into how external scripts and tools contribute to worsening your site speed. You can quickly analyse which third party vendors contribute most transfer size and main thread execution time to your overall scores.
Real-user metrics
All Sites you’ve already added to Calibre have an automatically generated CrUX Dashboard. The CrUX Dashboard provides real user metrics for Core Web Vitals and Web Vitals collected from the visitors of your site.
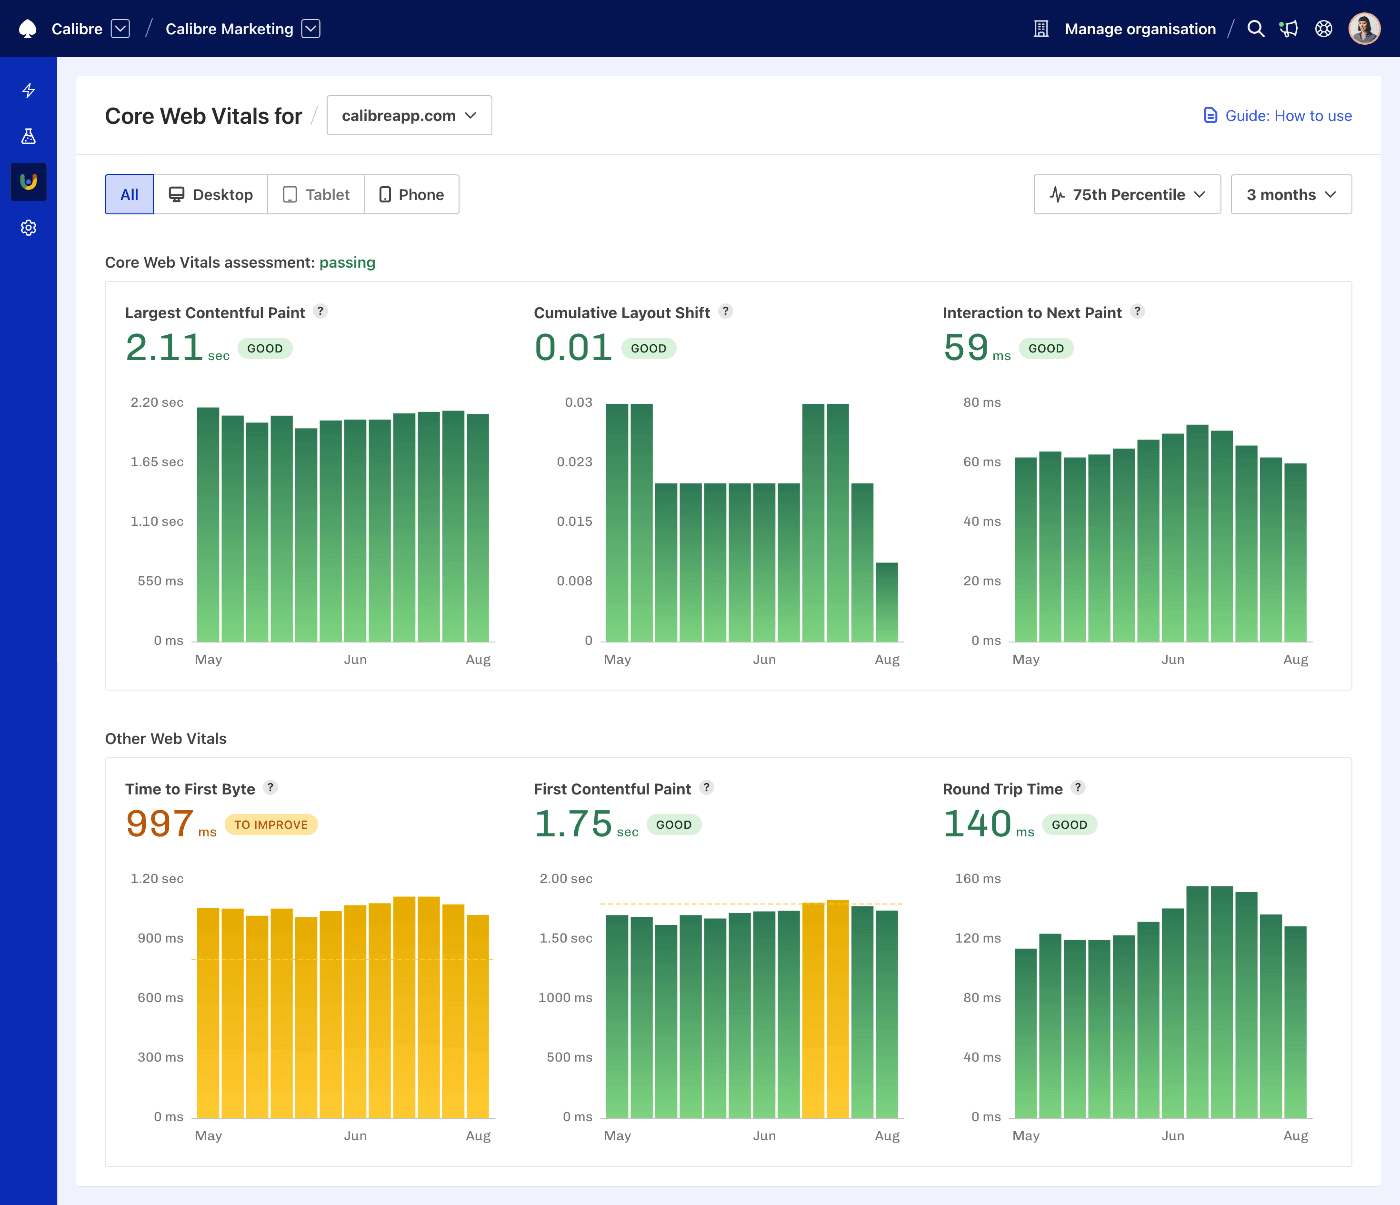
You can change between the 75th percentile and histograms to spot trends or confirm if the majority of experiences are good. This report doesn’t require tracking script installation and is included in all Calibre plans.
Step 6: Organise work with Teams
Everyone has different needs and preferences for organising their work. Create Teams to assign people to work on specific Sites. Divide based on projects, areas of the business or add Teams for personal experimentation:
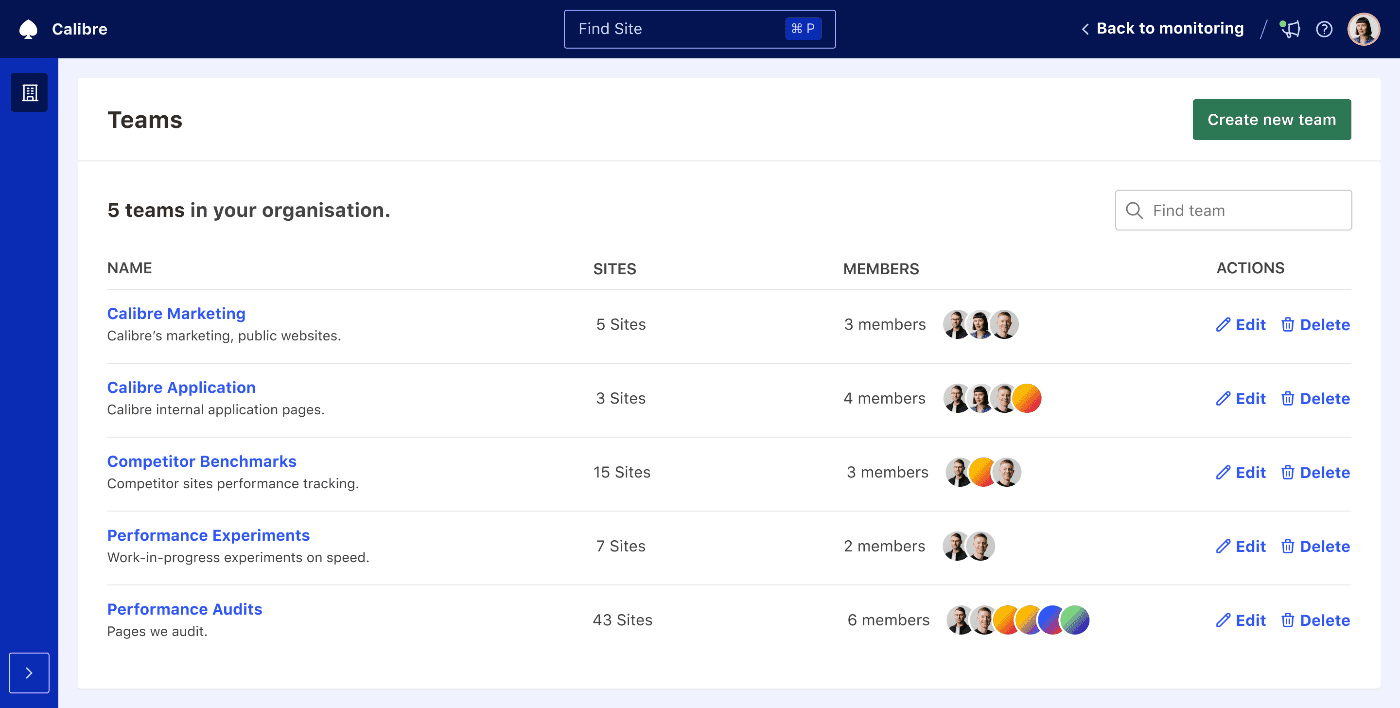
You can control access levels and avoid information overload. Teams make it easy to collaborate and focus on what’s important to you.
Once you have completed these steps, continue your journey with Calibre by discovering all features or reaching out to our technical support team for help in establishing your speed strategy.
On this page