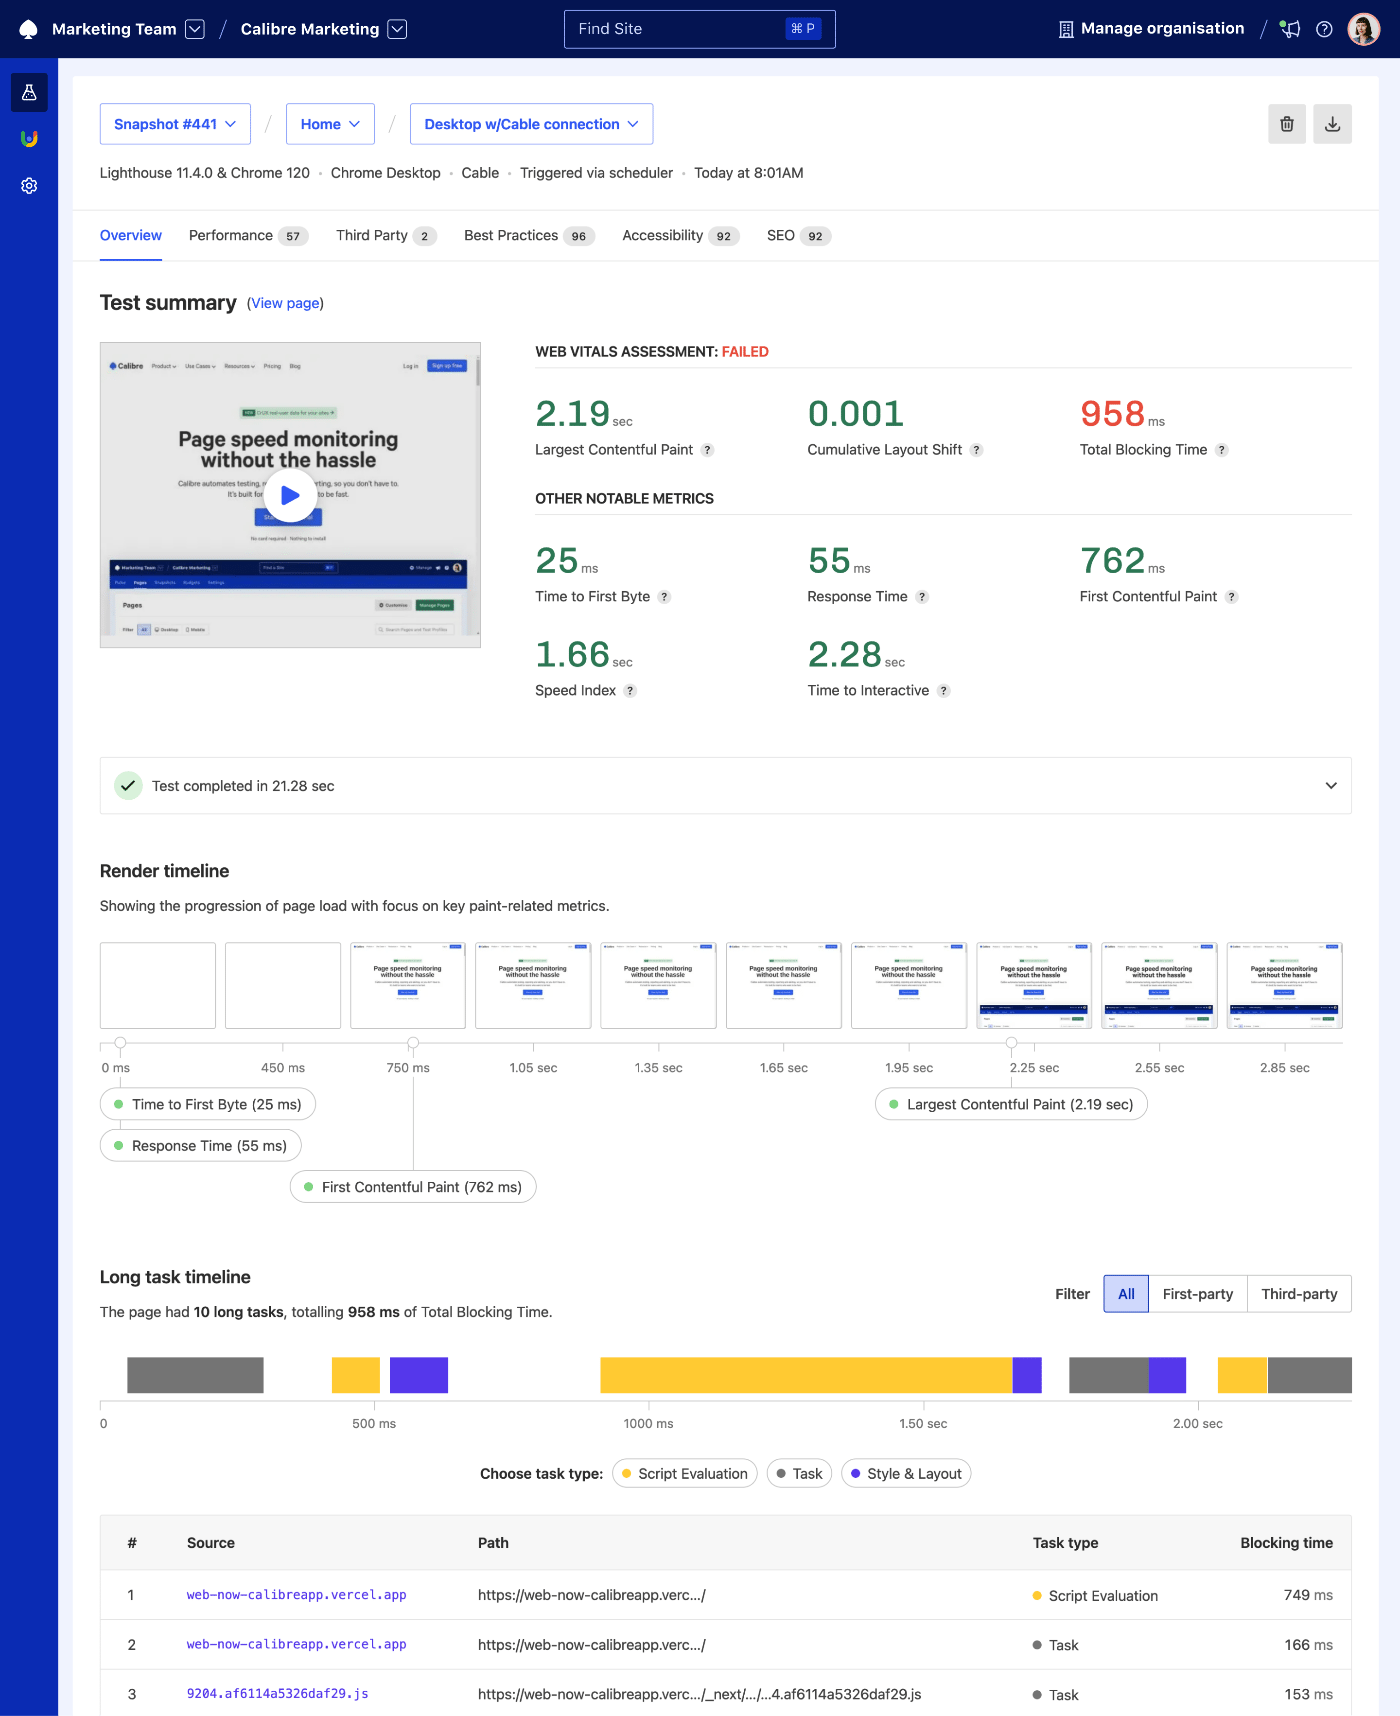
The Snapshot Overview contains critical details about your page's performance: Web Vitals assessment and other significant metrics, video, imagery of the page rendering process, test log, breakdown of assets, requests and blocking JavaScript activity. All to give you the necessary information to identify what specific area you should focus on to get the most impactful performance improvement.
Switching pages and Test Profiles#
- Click on the page or Test Profile name in the top section of the page.
- Select the page or Test Profile you'd like to view a report for. Your Snapshot Overview will be updated accordingly.
Key metrics#
In the first section of the Snapshot Overview, Calibre highlights your Core Web Vitals assessment status (failed, passed or not graded) alongside the following web performance metrics:
Web Vitals:
- Largest Contentful Paint
- Cumulative Layout Shift
- Total Blocking Time
Other notable metrics:
- Time to First Byte
- Response Time
- First Contentful Paint
- Speed Index
- Time to Interactive
All metrics are colour-coded, so you will know if a given area needs more work: green (good), amber (needs improvement), and red (poor). You can also check your Core Web Vitals assessment based on real-user metrics in the CrUX Dashboard.
Render video#
The render video provides a helpful visual representation of the page rendering process during the test. It's helpful for identifying specific rendering issues, such as unwanted layout shifts or slow loading critical resources. The render video is recorded accordingly with the resolution of the selected Test Profile device.
Test log#
The test log showcases the progression and status of a test. It lists key settings (Test Profiles, cookies, HTTP headers and authentication) and any potential errors or skipped audits. With this information, you can ensure authentication is set up correctly and tests are completing successfully.
Render timeline#
The render timeline is a visual summary consisting of screenshots taken during testing your page and markers of key paint timings (Response Time, Time to First Byte, First Contentful Paint and Largest Contentful Paint). Between the render timeline and video, you can pinpoint areas that can be optimised when serving content.
Long Task Timeline#
The Long Task Timeline portrays long JavaScript tasks that are blocking the browser's main thread for more than 50ms. This can often lead to the page freezing and becoming unresponsive, unnecessarily draining the device battery and a range of other user experience headaches.
Long Task Timeline helps quickly pinpoint which scripts cause web performance problems and analyse the contributions to Total Blocking Time. To debug further, you can also filter long tasks by first and third-party.
Asset transferred by type#
The asset transferred by type chart allows you to quickly understand the makeup of your page, from HTML, CSS, imagery, to fonts, JavaScript, and other assets. This is a great opportunity to find areas where you can remove or optimise a certain type of resource. Similarily to Long Task Timeline, you can filter by first and third-party assets.
Request table#
The request table lists all requests made when loading a page. The number and priority of requests can have a hugely beneficial impact on fast page load, if implemented right. To ensure critical files are requested and load in the right order, you can find the following information for each request:
- Method
- Status
- Name
- Domain
- Protocol
- Priority
- Type
- Transferred size
- Size
- Compression
- Time
- Third Party
- Request headers
- Response headers
Customise the request table#
You can customise the request table to display what's most critical to what you are currently researching by clicking the cog icon above the table. Checking or unchecking any of the request details will show (or hide) them in the request table.
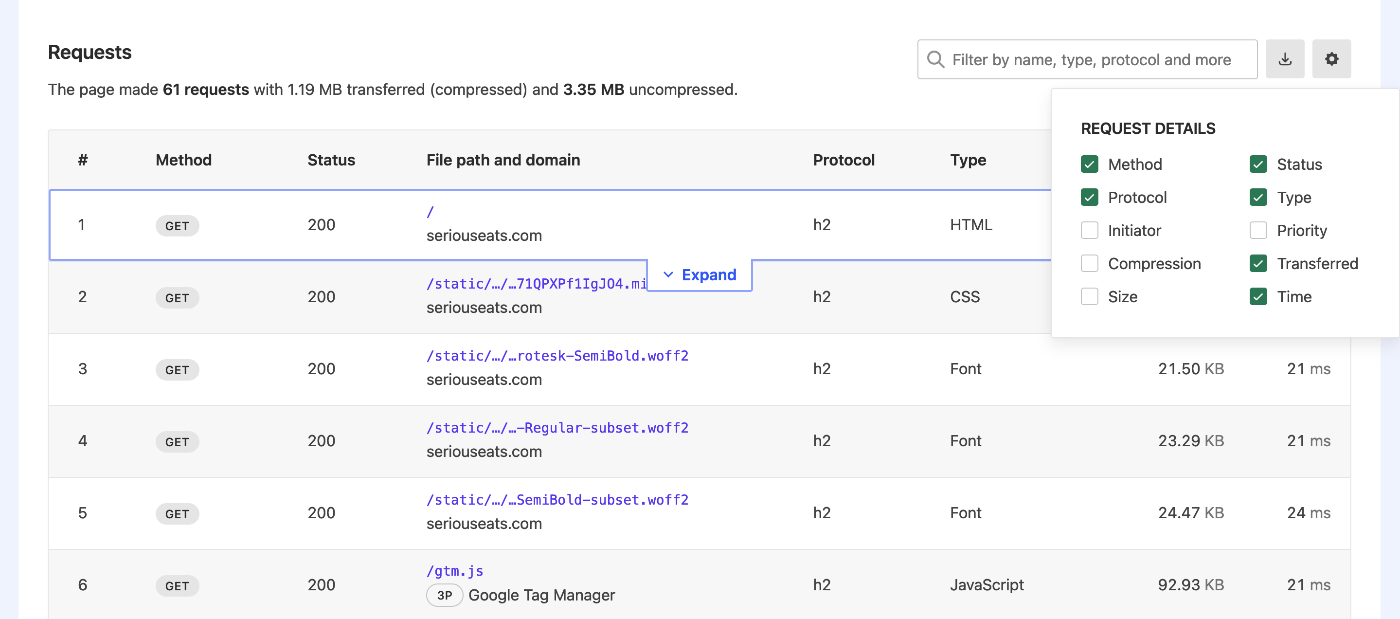
To view additional information (Timings, Request and Response Headers), hover over a selected request and click the Expand button.
Filter or export requests#
The request table can be also filtered. You can search for specific keywords corresponding to most information for each request, excluding time, size and transferred values.
If you'd like to take this data elsewhere, you can also download a HAR (HTTP Archive) JSON file which contains all of the request information. To do this, click on the Download icon.