

Dozens of metrics measure aspects of site speed and performance. Each has its pros and cons, but because there are so many metrics, it can take time to know what to track for the best results.
For this reason, Google launched the Core Web Vitals (CWVs) initiative that raises a subset of metrics above all others. These metrics have been selected because they each measure a crucial aspect of user experience: loading, interactivity, and visual stability. These metrics shouldn't be the be-all, end-all of SEO or performance metrics. However, if you score well with them, that's a strong indicator that your site provides a good experience for your visitors. Plus, because CWVs are part of Google’s ranking factors, improvements net you more organic traffic.
However, improving site speed is something that takes time to happen. Learn what Core Web Vitals are and how to use them with this post to improve your traffic, conversions, and more.
What are Core Web Vitals?#
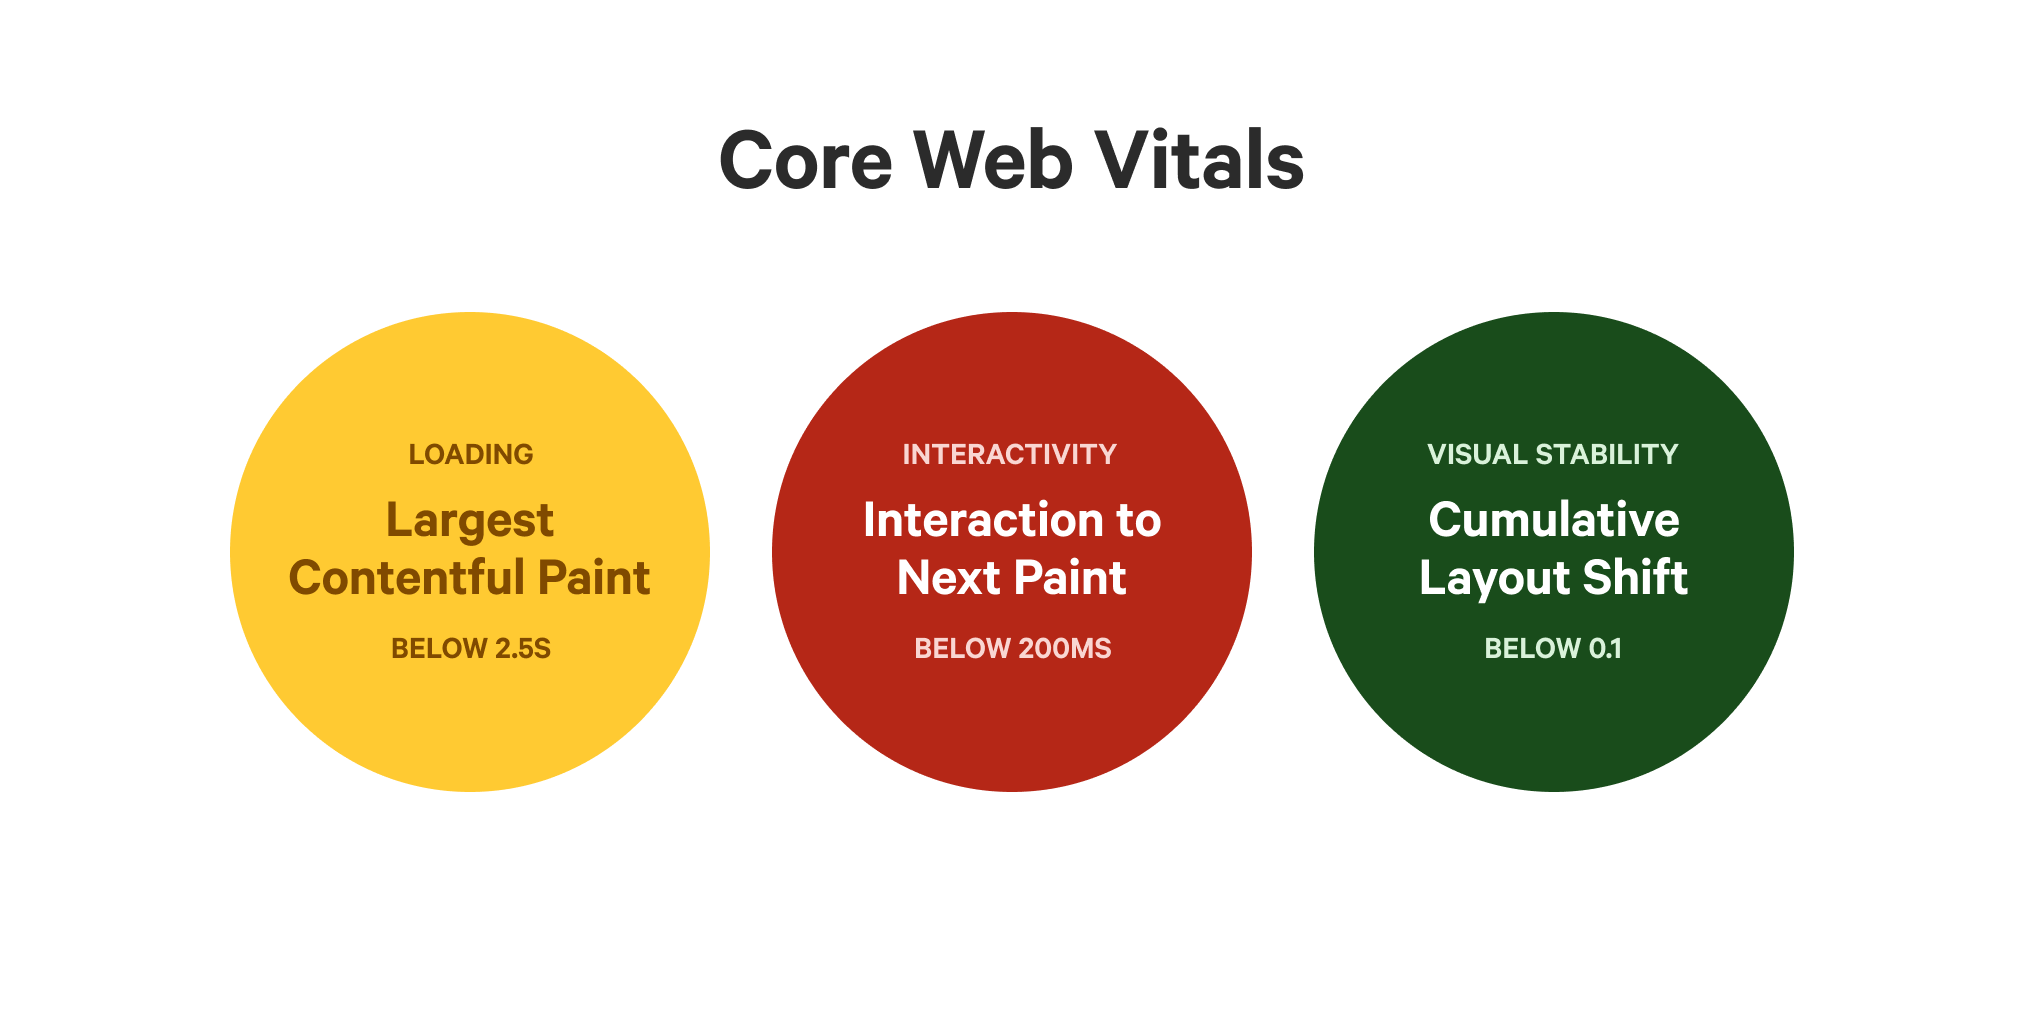
The Core Web Vitals are a set of performance metrics that quantify page loading speed, interactivity, and visual stability. Taken as a whole, they represent a snapshot of how accessible, quick, and responsive your page is for your visitors.
Core Web Vitals can be measured in two ways: synthetically or with real user monitoring (RUM). Synthetic monitoring uses test agents to test your site pages, while RUM bases its measurements on data from people visiting your site. Not only will these different measuring systems give you different results, but they also require slightly different metrics.
Currently, the Web Vitals for synthetic monitoring include:
- Largest Contentful Paint (LCP): For measuring overall page loading speed.
- Cumulative Layout Shift (CLS): For calculating the visual stability of the page.
- Total Blocking Time (TBT): For measuring page interactivity.
Core Web Vitals with RUM data is similar. The only change is that TBT is replaced with Interaction to Next Paint:
- Largest Contentful Paint (LCP): For measuring overall page loading speed.
- Cumulative Layout Shift (CLS): For calculating the visual stability of the page.
- Interaction to Next Paint: For measuring page interactivity.
Why should I track the Core Web Vitals?#
Everyone wants to improve UX and performance. However, before the CWVs, it was challenging to understand whether your changes led to measurably better outcomes. Core Web Vitals take the guesswork out of optimising your performance, so you can experiment with your site, track performance, and adjust pages accordingly.
Beyond improving UX, tracking and achieving CWV targets helps businesses achieve OKRs and boost visibility in search.
Influences Google Search rankings#
Since Google started rolling out Core Web Vitals in 2021, these metrics have become a direct ranking factor contributing to how visible your site will be on the world's largest search engine.
Although content relevancy and quality are still the top priority, Google gives the edge to sites with better page experiences, including ones that perform well in the Core Web Vitals. So if you and your direct competitor are putting out equally fantastic content, having better CWV scores could be the tiebreaker you need to rank higher on search pages. In fact, according to Sistrix, sites that pass all CWV tests get an extra 3.7% visibility on Google SERPs compared to sites that don’t.
You rarely get measurable SEO signals from Google, so any site relying on SEO should be focused on improving CWVs. If you don’t, you can bet your organic competitors will.
Impacts key business metrics#
When it comes to the link between business growth and improved CWVs, the evidence is clear:
- Vodafone: 8% increase in sales by improving Largest Contentful Paint (Source).
- Yahoo! Japan News: 15% increase in page views by improving Cumulative Layout Shift (Source).
- Renault: 13% increase in conversions caused by 1 second LCP improvement (Source).
- Swappie: 42% mobile revenue increase by improving Core Web Vitals (Source).
People enjoy using sites that are quick to load and responsive. When your site's insufficient Core Web Vitals make it unusable for certain people and causes others to leave for better-performing alternatives. These choices happen at the individual level, but they add up to seismic shifts for website and business KPIs.
Makes it easier to communicate about speed#
With a short set of critical site performance metrics (versus the dozens available), it’s easier to explain and consistently communicate them across different teams, roles, and departments. This allows whole teams to contribute to web performance instead of leaving it to a handful of developers. More people contributing to the solution means better and quicker results for a faster-performing site.
By using CWVs to define how you talk about site speed within your organisation, you'll be able to:
- Set shared performance budgets across departments.
- Educate team members on how their roles impact Core Web Vitals.
- Measure and track overall site performance.
Also, because the Core Web Vitals are split among several metrics, you can see where your site performance is falling short and doing well. Previously, many people used the Lighthouse Performance Score to judge how well they optimised a site. However, this didn't work well since a single number makes it difficult to dissect how well your site is doing.
Core Web Vitals provide enough metrics to see what's going wrong, but not so many that it overwhelms less-engaged people.
How Google tests your Core Web Vitals#
Core Web Vitals for ranking purposes are collected by the Google Chrome browser directly from its users. After the speed data is fully anonymised, the aggregated data is made available through the Chrome User Experience Report (CrUX).
However, CrUX data comes with serious limitations:
- It's limited to sites and pages that meet traffic thresholds.
- Only collects data from Google Chrome.
- Excludes the iOS operating system.
- Data is only published monthly.
While CrUX is a substantial dataset, it might not be a complete picture of your audience's experiences. If Google hasn't indexed your site in the report because it doesn't meet traffic thresholds, you won’t see any Core Web Vitals field data. CrUX's monthly publishing cadence also makes it challenging to react quickly to potential speed regressions or observe wins as they happen.
There are tools to visualise CrUX report data, but often not without effort and a complex setup. That's why we built Calibre’s Core Web Vitals Test—a free tool that'll test your site and pages. Type in the URL you'd like to test, and you'll get CWV test results.
Check if your site passes the Core Web Vitals assessment in one click.
How you can track your Core Web Vitals#
Web Vitals are now available in most free speed tools, such as Lighthouse, PageSpeed Insights, Chrome User Experience Report, Search Console's Core Web Vitals report, Chrome Developer Tools and the Web Vitals Extension.
These tools might be helpful for one-off testing, but they don’t allow you to monitor your site continuously easily. If you want to spot performance issues early or understand how optimisations affect your site, you'll need to test each page one by one and then manually plot that data. Multiply that effort by the number of pages on your site, and you’re looking at a lot of work to monitor web performance.
Using the Calibre platform makes this process a whole lot easier. With Calibre, you can schedule automatic site speed tests on your pages at a specific cadence, so you always have the latest data. You'll also be able to easily set goals and view performance changes over time, so you see what helps or hurts your Web Vitals.
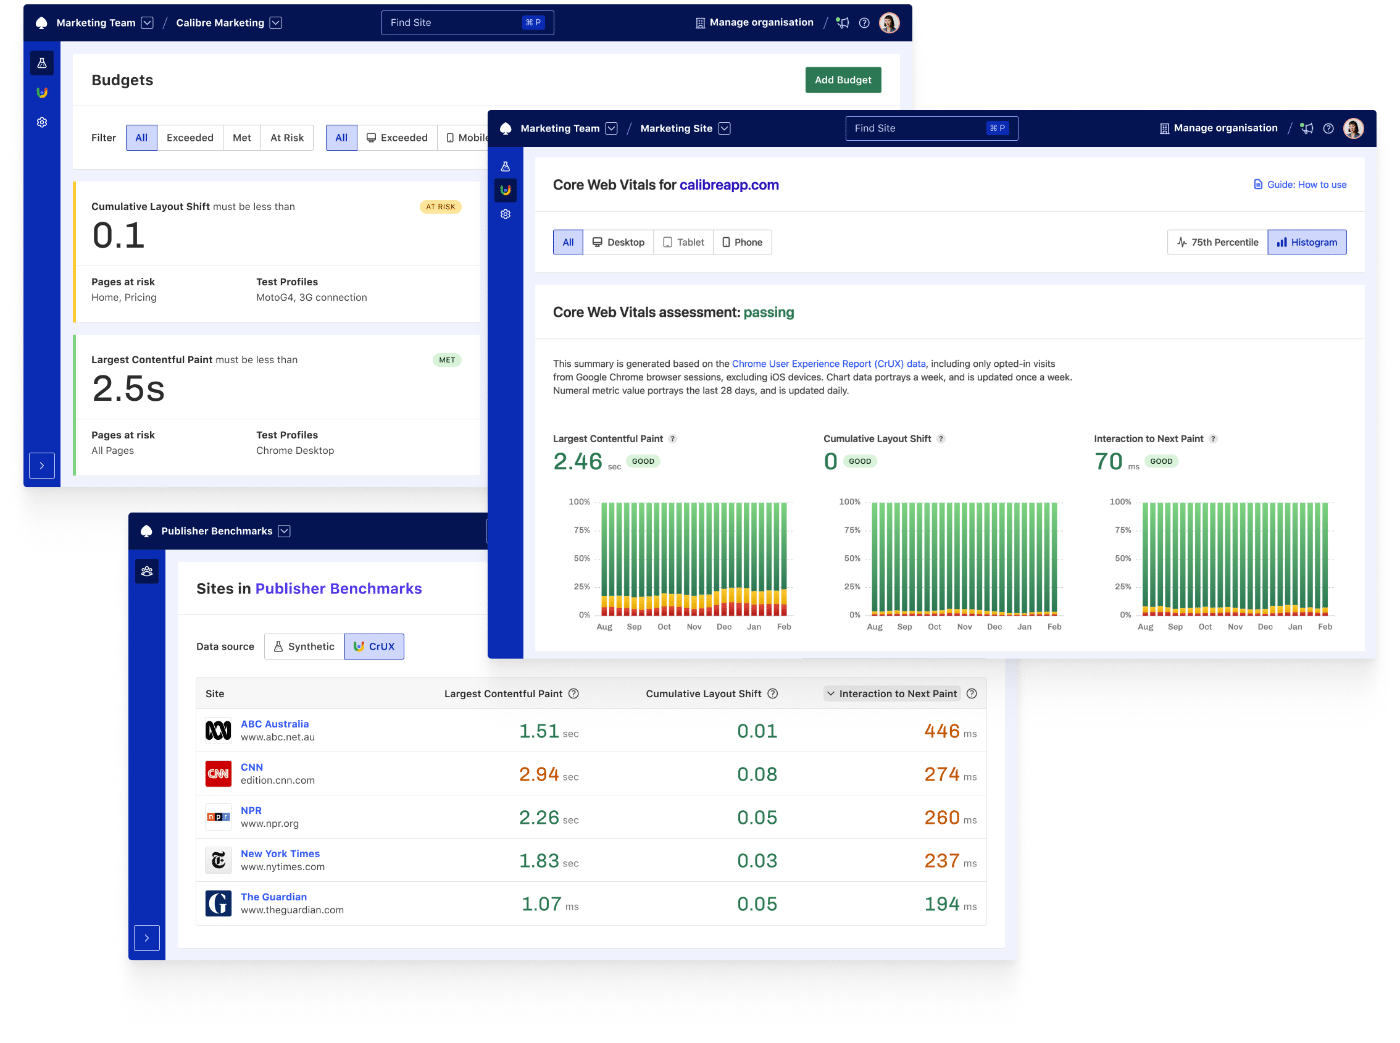
Calibre prioritises Web Vitals metrics in its reports, which means you'll see them highlighted across the entire platform. You can visualise them on charts, set budgets, receive email speed reports and get Slack alerts that keep you up to date on your site's CWVs—all with minimal input.
What are the recommended values for each CWV?#
Most performance metrics have recommended ranges for a good user experience. Below, we share the Web Vitals ranges you should aim for to avoid search ranking penalties.
| Metric | Good Measurement | Poor Measurement |
|---|---|---|
| Largest Contentful Paint | ≤ 2.5s | > 4s |
| Cumulative Layout Shift | ≤ 0.1 | > 0.25 |
| Total Blocking Time | ≤ 300ms | > 600ms |
| Interaction to Next Paint | ≤ 200ms | > 500ms |
To ensure Core Web Vitals stay within these ranges, we strongly recommend you use performance budgets and test changes before releasing to production. The earlier you spot changes and regressions, the faster you can prevent them from reaching potential and existing customers.
How to optimise each Core Web Vital#
If you’re new to SEO or performance, optimising for Core Web Vitals can be a little intimidating. Although some site performance optimisations will require specialised knowledge, there’s still much anyone can do with basic knowledge.
Here's a quick overview of each metric, what it measures, and how you can optimise for it.
Largest Contentful Paint#
Largest Contentful Paint measures how long it takes for a browser to load the most significant element that people will immediately see when they open your page.
For instance, an LCP element might be a large image at the top of a page. The quicker that element loads, the better your measurement.
To start optimising your LCP, you should:
- Use a tool like Calibre to identify what your LCP element is.
- For image LCP elements, run the image file through a compressor and use the most efficient image file types. Learn more in our guide to image optimisation.
- For text elements, try using system fonts instead of web fonts. Learn more in our guide to typography.
For in-depth instructions, check out our guide to improving your LCP.
Cumulative Layout Shift#
Cumulative Layout Shift measures how much a web page moves during the loading process.
If you've ever tried to click on a button only to have it move on the page, you'll have experienced layout shifts. Your goal with CLS is to have as little movement as possible.
To start optimising your CLS, you should:
- Make sure all your images, embeds, and ads have defined dimensions.
- Remove JavaScript that loads late and disrupts the layout.
- Deliver web fonts as critical assets.
For in-depth instructions, check out our guide to improving your CLS score.
Total Blocking Time#
Total Blocking Time measures how long a browser is blocked from handling user inputs due to loading other resources.
Browsers typically can only do one task at a time, like loading an image or laying out a page. For this reason, it’s considered best practice to break up or optimise more intensive tasks so that there are never long periods of time (more than 50ms) when user inputs (like a click or tap) are blocked. Optimised in this way, pages never feel unresponsive, even while loading.
To start optimising your TBT, you should:
- Minify and compress your JavaScript and CSS.
- Remove or delay non-critical third-party scripts.
- Use facades and lazy loading to delay non-critical tasks.
For in-depth instructions, check out our guide to improving your TBT.
Interaction to Next Paint#
Interaction to Next Paint measures how long it takes for browsers to respond after user input.
Typically, your INP score equals the slowest response time after user input, like a click or tap. The longest response can happen anytime during a visitor's time on the page, unlike FID, which only measures the first interaction.
To start optimising your INP, you should:
- Reduce JavaScript and third-party scripts
- Avoid JavaScript frameworks that require JS to render pages.
- Optimise your JavaScript hydration to prioritise UX updates.
For in-depth instructions, check out our guide to improving your INP.
Make site speed a priority#
With Google’s renewed interest in making sites more user-friendly, teams must reevaluate how they approach web performance. Instead of relying on a couple of people to do the majority of the work, getting everyone involved with web performance is now more important than ever.
If you’re interested in improving your site's performance, sign up for our Performance Newsletter, explore our blog, and start monitoring your sites. With the knowledge accumulated on our site and the testing capabilities of the Calibre platform, you can see how easy it is to improve your Core Web Vitals and build a better site for your customers.