View Core Web Vitals for All Sites
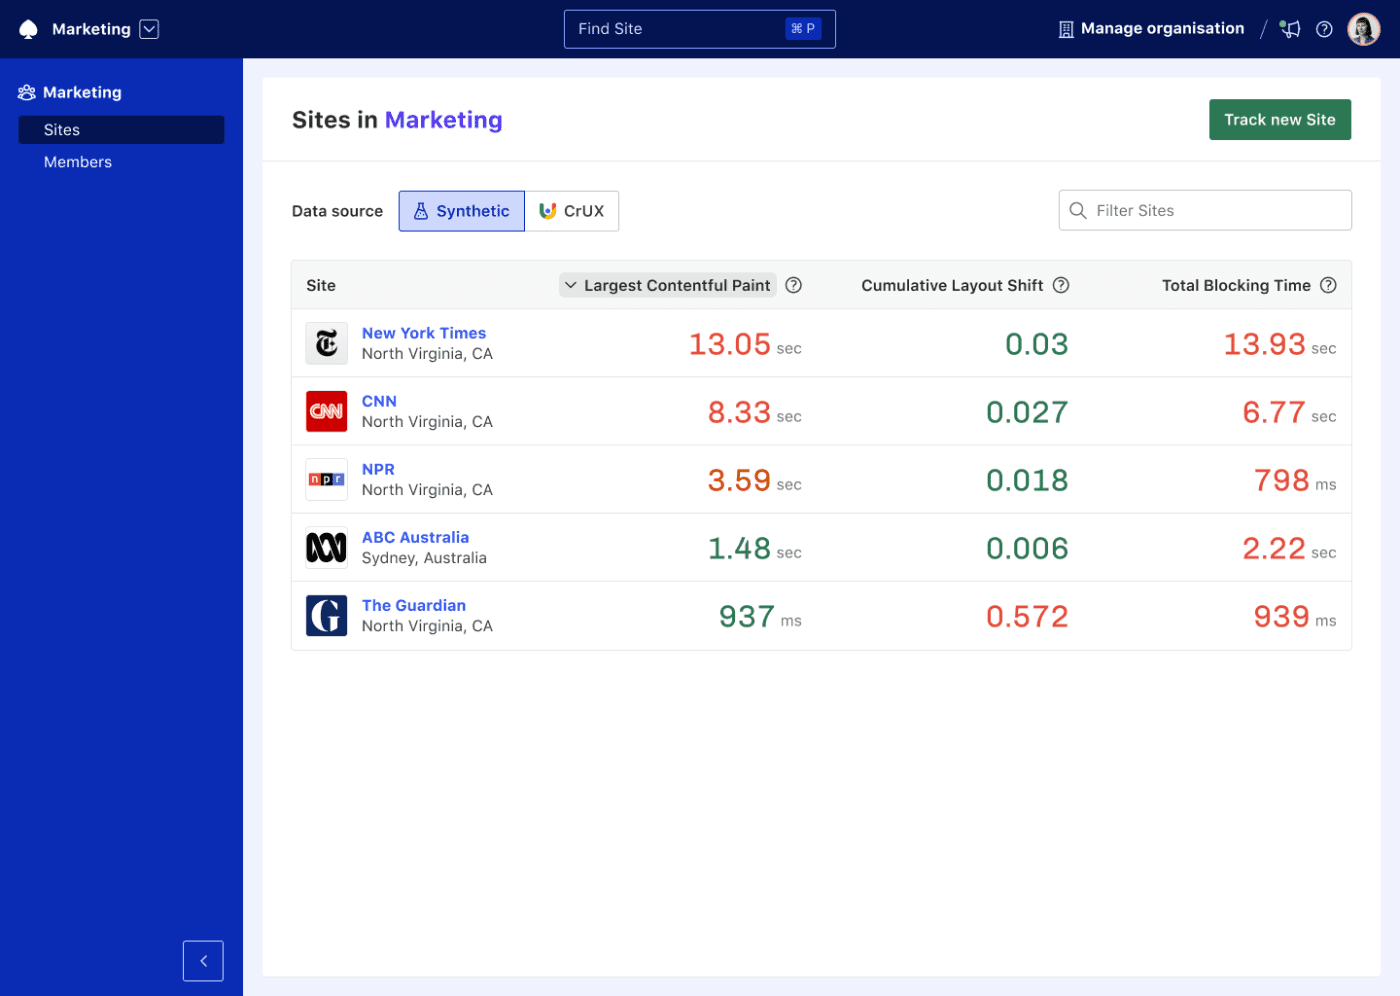
The Your Sites report lists all Sites for each Team alongside their Core Web Vitals to provide you with a bird’s-eye view of overall performance. This report is available for each Team you are a member of, or all Teams (if you are an administrator of an organisation).
Data sources
You can switch between two data sources:
| Data source | Description | Methodology |
|---|---|---|
| Synthetic | Calibre’s lab test data collected through manual and automated tests. | Displays a median (P50) aggregate measurement for all Pages and Test Profiles for the last Snapshot. |
| CrUX | Real user monitoring data originating from Google’s Chrome User Experience Report (CrUX) API based on pre-defined user eligibility. CrUX is the official Web Vitals program dataset, which is used as a signal for Google’s search ranking algorithm. | Displays the last 28 days of 75th percentile (P75) origin data from CrUX. |
Available metrics
| Data source | Metrics included |
|---|---|
| Synthetic | - Loading: Largest Contentful Paint - Visual stability: Cumulative Layout Shift - Interactivity: Total Blocking Time |
| CrUX | - Loading: Largest Contentful Paint - Visual stability: Cumulative Layout Shift - Interactivity: Interaction to Next Paint |
Metric grading
Metrics are coloured according to their value set against recommended ranges for best performance:
- green: good
- amber: needs improvement
- red: poor
Why is a metric measurement missing?
In some cases, you will notice a dash (—) in the column corresponding to a metric. This can happen for multiple reasons, depending on chosen data source:
- Synthetic: the most recent test did not complete successfully.
- Synthetic: there is no JavaScript assets and runtime, or there’s a significant amount of repeated JavaScript activity, which causes the browser’s main thread to never be at rest for the duration of the test. In this case, the Total Blocking Time and Time to Interactive measurements cannot be collected.
- CrUX: there is no data present for a given domain (or a singular metric for a domain) as it doesn’t meet user eligibility criteria.
Finding a Site
If you are managing many Sites, finding the right one should be easy. You can quickly filter the Site list by using the Filter sites search box.
Tracking a new Site
You can add a new Site directly from Your Sites page by clicking the Track new Site button.
On this page