The Metric page provides more granular history and tracking information for a selected metric. If you are looking to work on a specific area of web performance, this is a great place to start analysing.
Analysing metric charts#
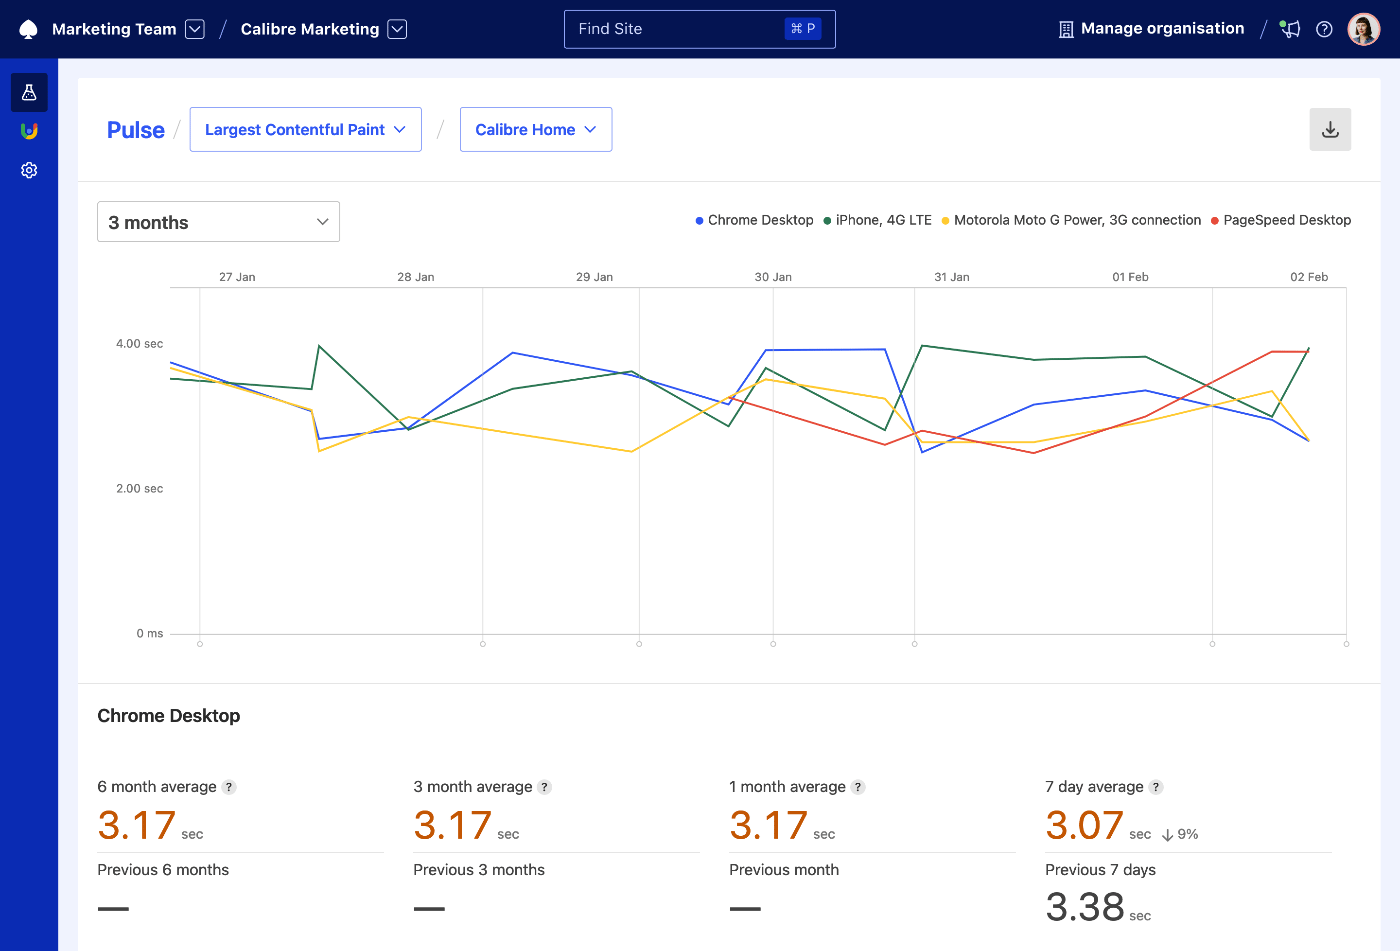
Each metric chart can have multiple, coloured lines corresponding to Test Profiles set up for the Site, so you can quickly identify which areas need most improvement.
If you are using Deployment Tracking, the charts will also have vertical lines signifying each release, so it’s easy to identify the correlation between speed changes.
Analysing value changes over time#
For each Test Profile, Calibre lists a moving average of the metric value for 6, 3, 1 month and 7 days. With this data and accompanying percentage point change, you can quickly identify trends that have to be actioned.
Switching pages and metrics#
- Click on the page or metric name in the top section of the page.
- Select the page or metric you'd like to view a report for. Your Metric will be updated accordingly.