Check Performance Audits
Performance audits are a set of web performance checks performed by Lighthouse to ensure that a page can be accessed and interacted with. They are available for each Snapshot test, unless a test has been completed with partial results due to an error.
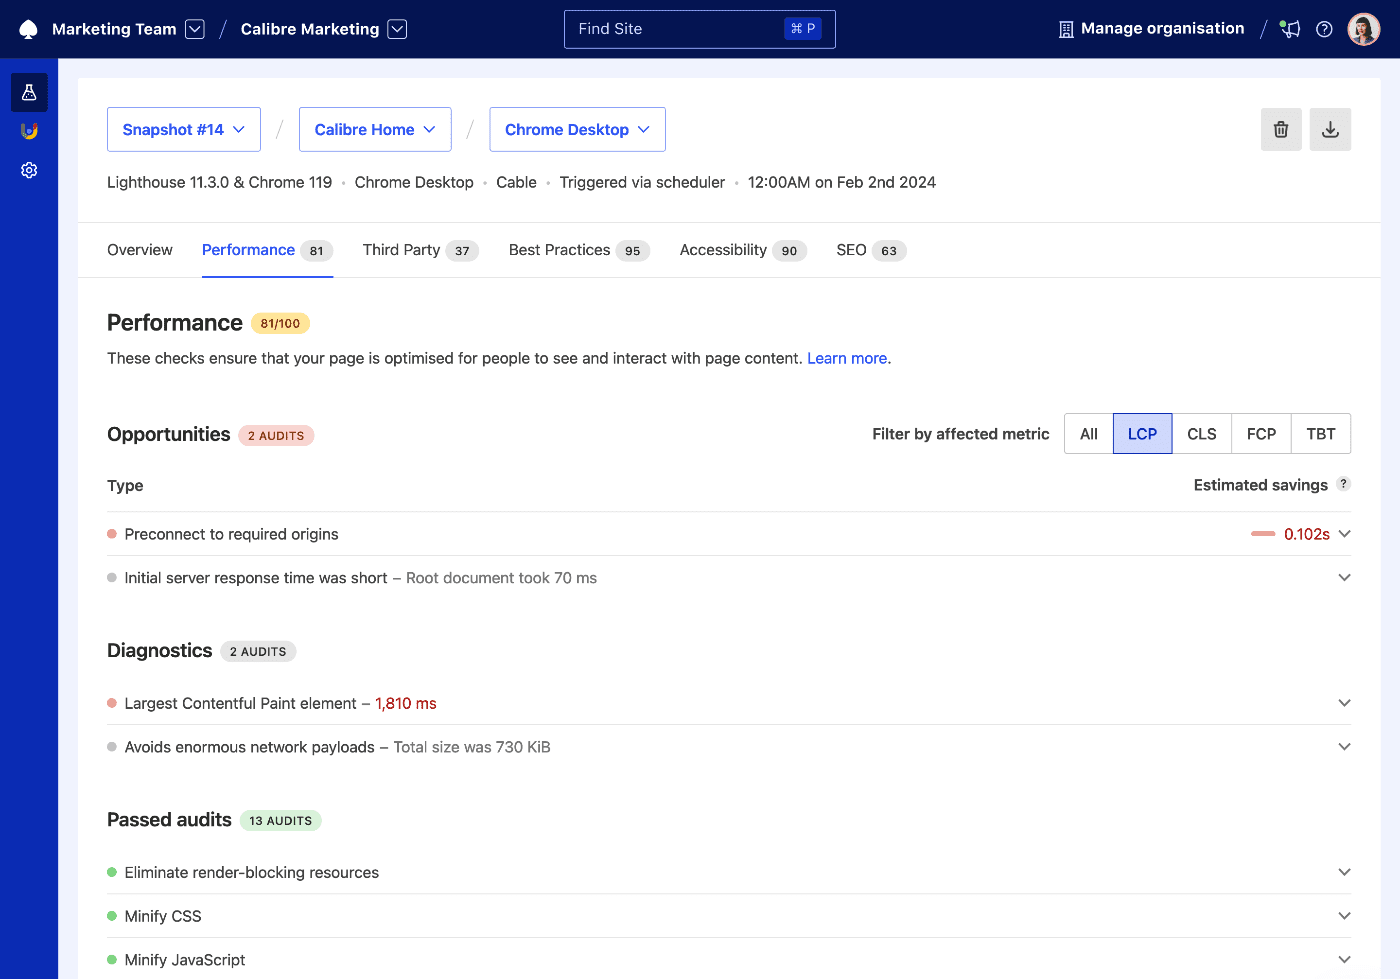
The Performance audit category receives a score between 0 and 100, known as the Performance Score, visible at the top of the audit section. Higher grading implies (but doesn’t guarantee) better performance.
Performance audit structure
Performance audits fall into the following categories:
- Opportunities
- Diagnostics
- Passed audits
To ensure the best performance, it’s essential to focus on the Opportunities and Diagnostics, outlining possible improvements to a given page. Each audit item includes:
- Title (e.g.: Largest Contentful Paint element)
- Audit description (e.g.: This is the largest contentful element painted within the viewport.)
- Measurement unit (optional, e.g.: 1,670 ms)
- Additional details (optional, e.g.: list of HTML elements)
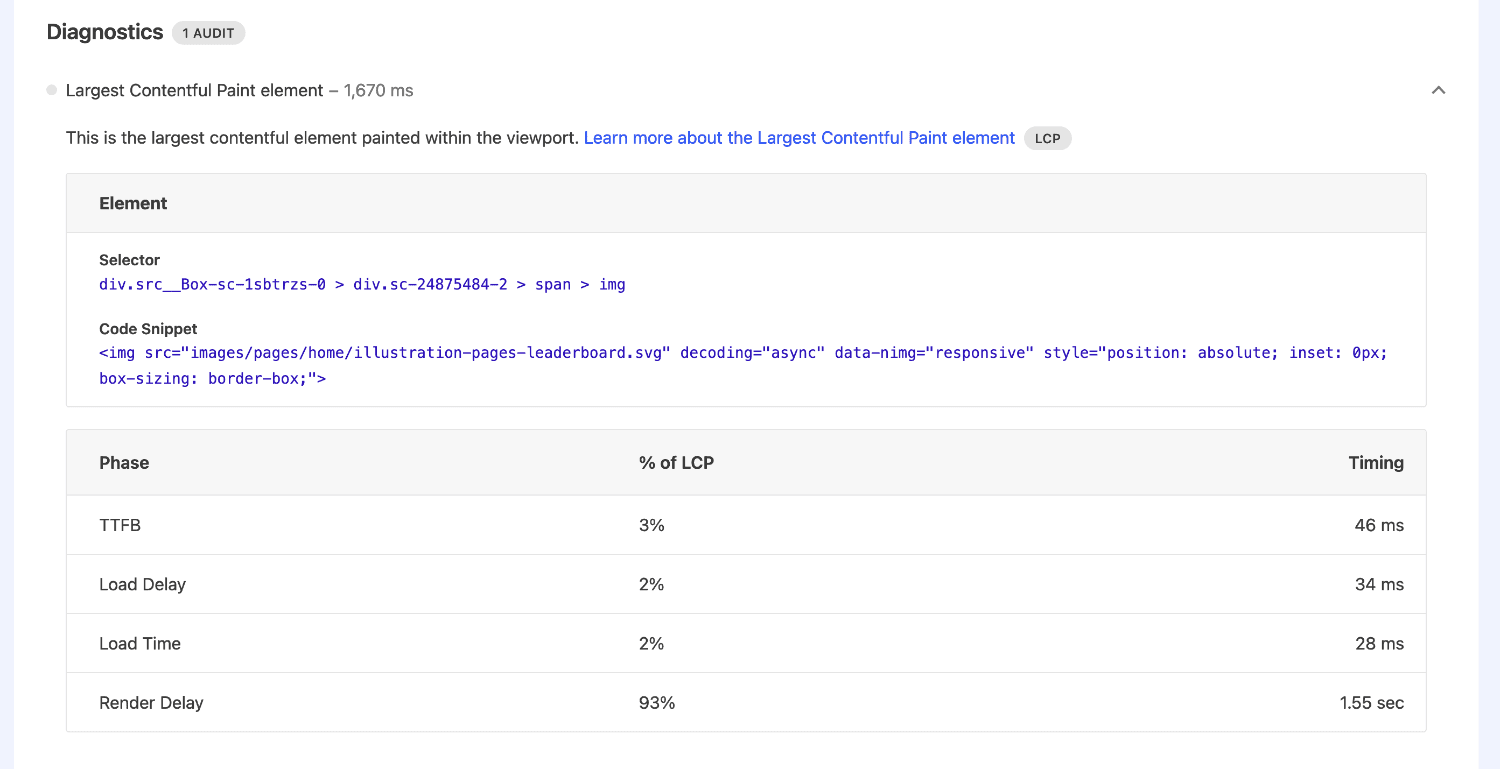
If an audit item features a table with more details, the table can be sorted by clicking on the column name.
Filter audits by metric affected
To make it easy to focus on the critical metrics for user experience, you can filter the audits by performance metric they affect, such as:
- Web Vitals: Largest Contentful Paint, Cumulative Layout Shift and Total Blocking Time
- Web Vitals: First Contentful Paint