Version 7.0.0 of the Calibre CLI and Node.js API is a major release that brings Real User Metrics and Chrome User Experience Report data to the command line.
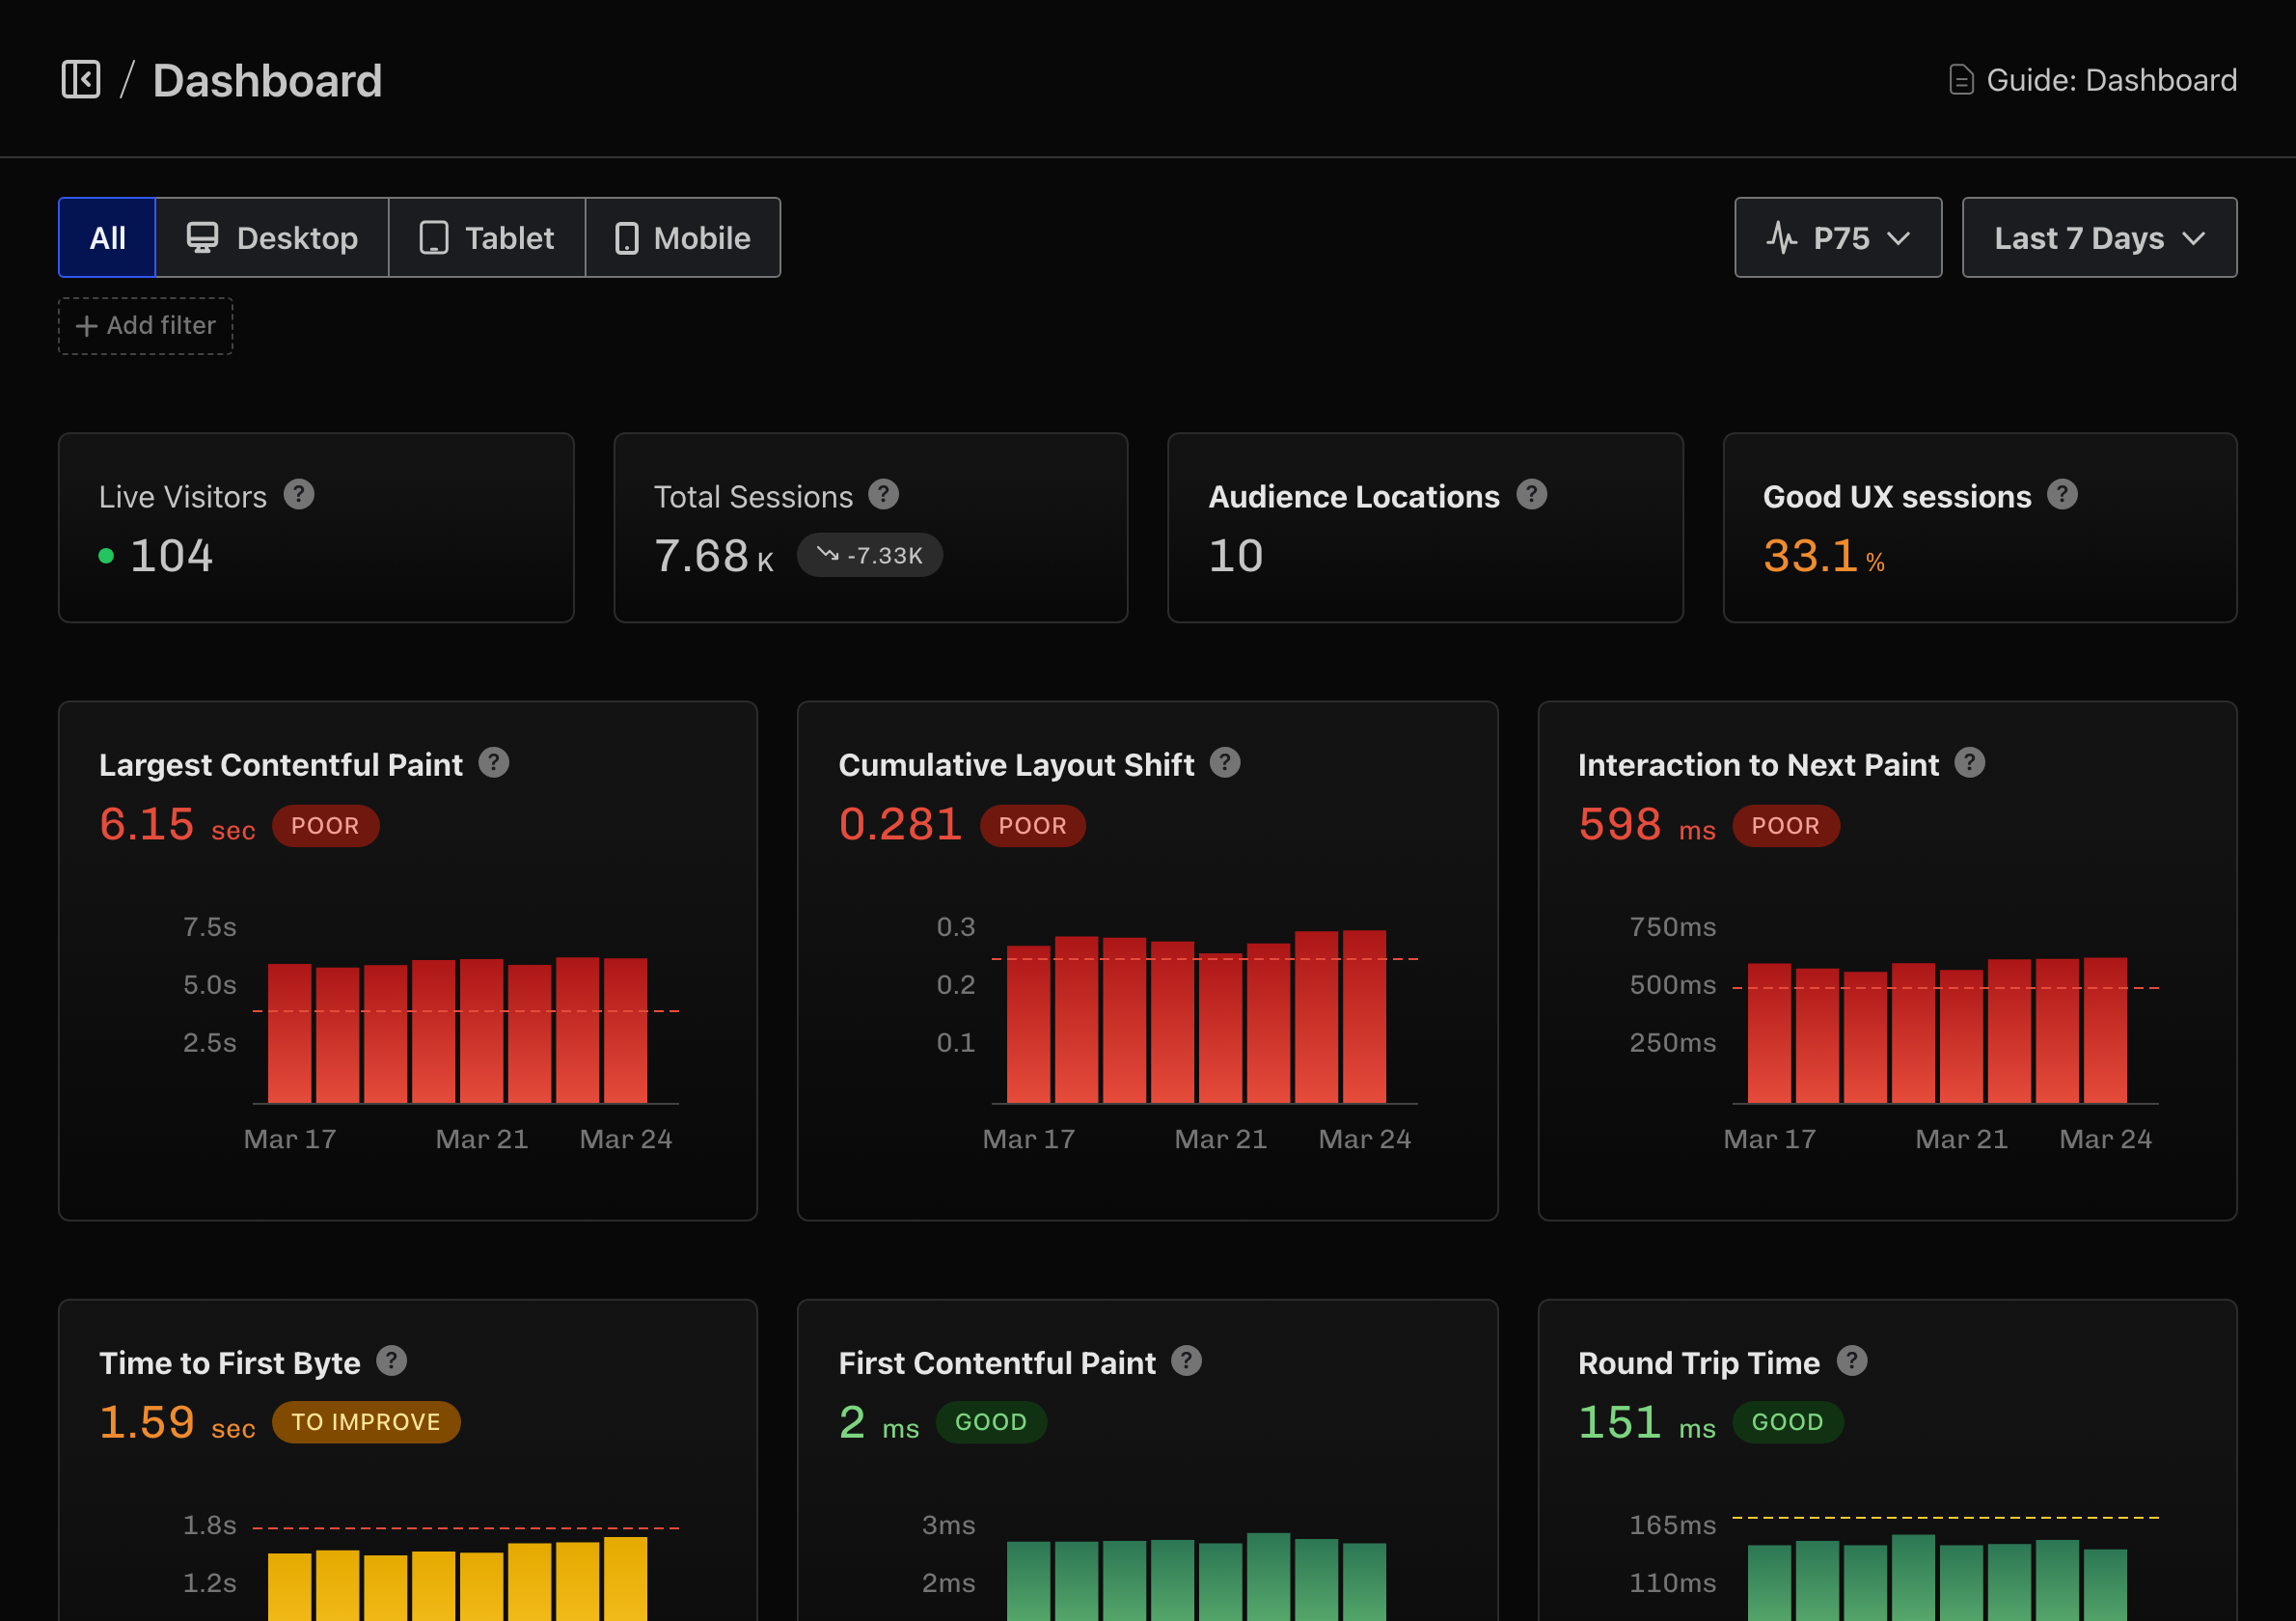
Now you can access RUM origin-level and page-level metrics, including live visitor counts, Web Vitals, UX ratings, and historical trends.
# Overall site performance summarised
calibre rum summary --site my-site
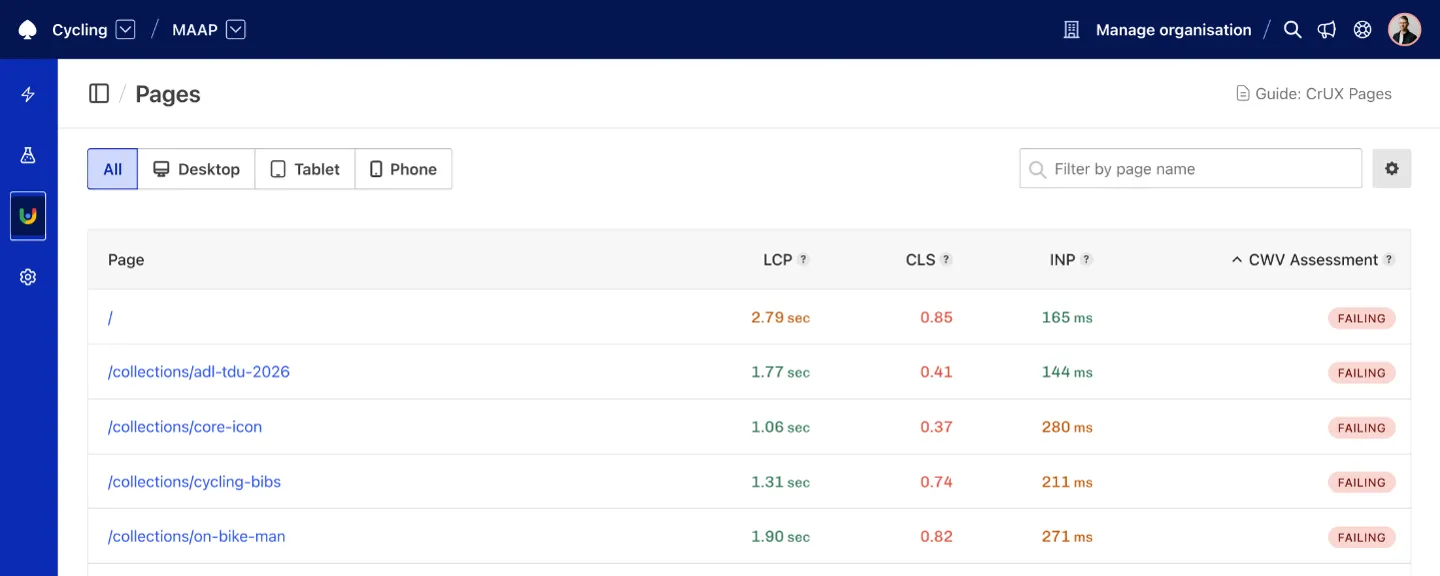
# See performance for each page
calibre rum pages --site my-site
# and more…Similar calibre crux summary, calibre crux urls and calibre crux url commands are available for CrUX data.
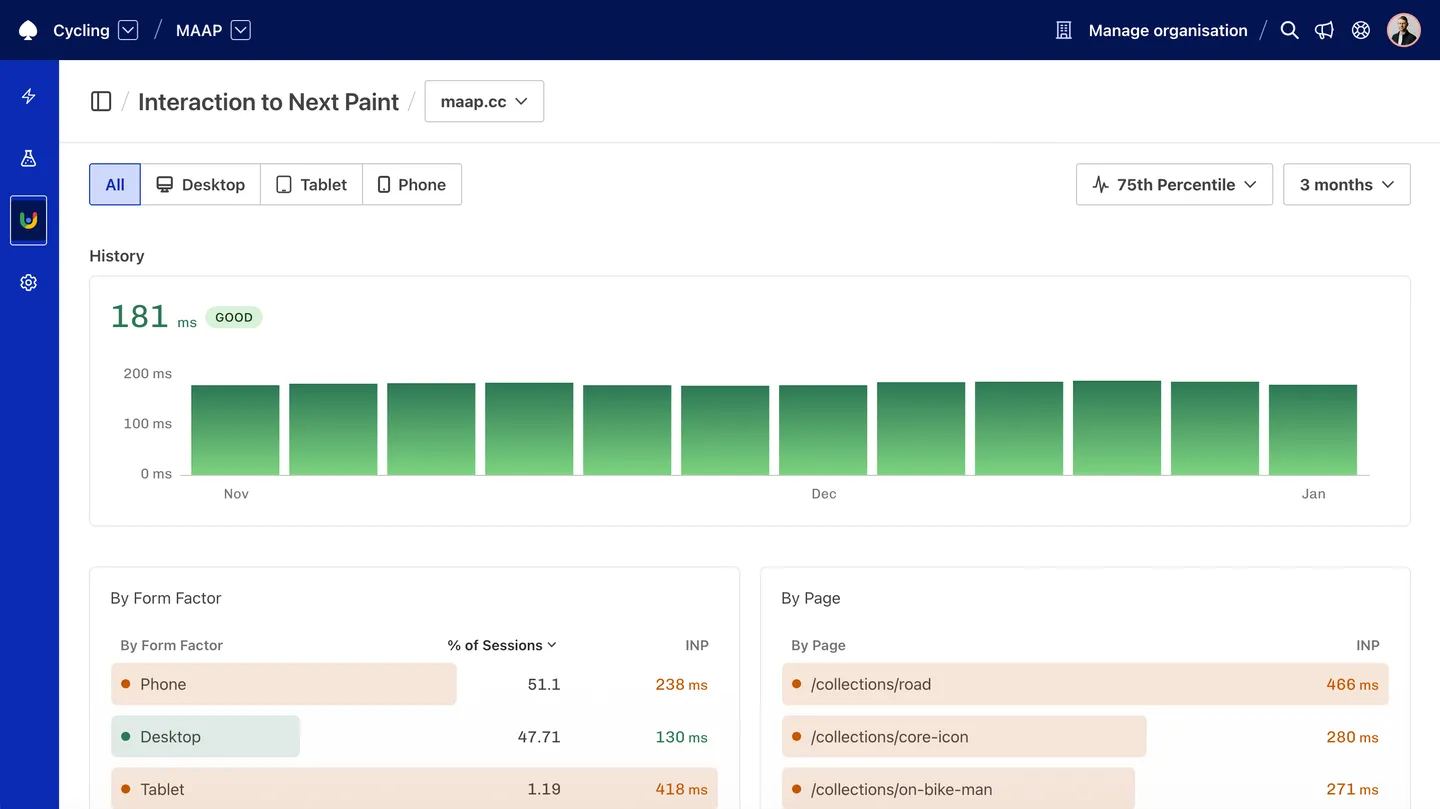
❯ calibre crux urls --site maap
✔ CrUX Assessment: Fail
Form factors: desktop 43.7% | phone 55.3% | tablet 1.1%

METRIC                    | P75
Cumulative Layout Shift   | 0.52
First Contentful Paint    | 1.33 sec
Interaction to Next Paint | 187 ms
Largest Contentful Paint  | 1.96 sec
Time to First Byte        | 359 ms
Image Load Delay          | 1.04 sec
Image Load Duration       | 286 ms
Image Render Delay        | 246 ms
Time to First Byte        | 418 ms
Round Trip Time           | 96 ms
Like all other commands, you can use --json to get machine-readable output for use in scripts and code agents.
7.0.0 release highlights#
calibre rum- access Real User Metrics data from your sitescalibre crux- access origin-level and URL-level Core Web Vitals from the Chrome User Experience Report, automatically collected by Calibrecalibre synthetic- existing synthetic monitoring commands are now namespaced undercalibre syntheticcalibre deploy- deploy commands elevated to their own top-level namespacecalibre site list- now shows which data sources (Synthetic, CrUX, RUM) are active per sitecalibre metric-list --type- filter metrics by data source (synthetic,crux, orrum)- Node.js API - new
CruxandRumprogrammatic exports
Deprecated aliases with warnings are provided for all moved commands, so existing scripts will continue to work while you migrate.
Using these new commands, you gain programmatic access to all your sites performance data. You can use this to build custom reports, integrate with other tools, or use code agents to interpret performance data and make recommendations.
See the full changelog on GitHub and CLI command documentation for detailed reference.