Track Core Web Vitals for Sites
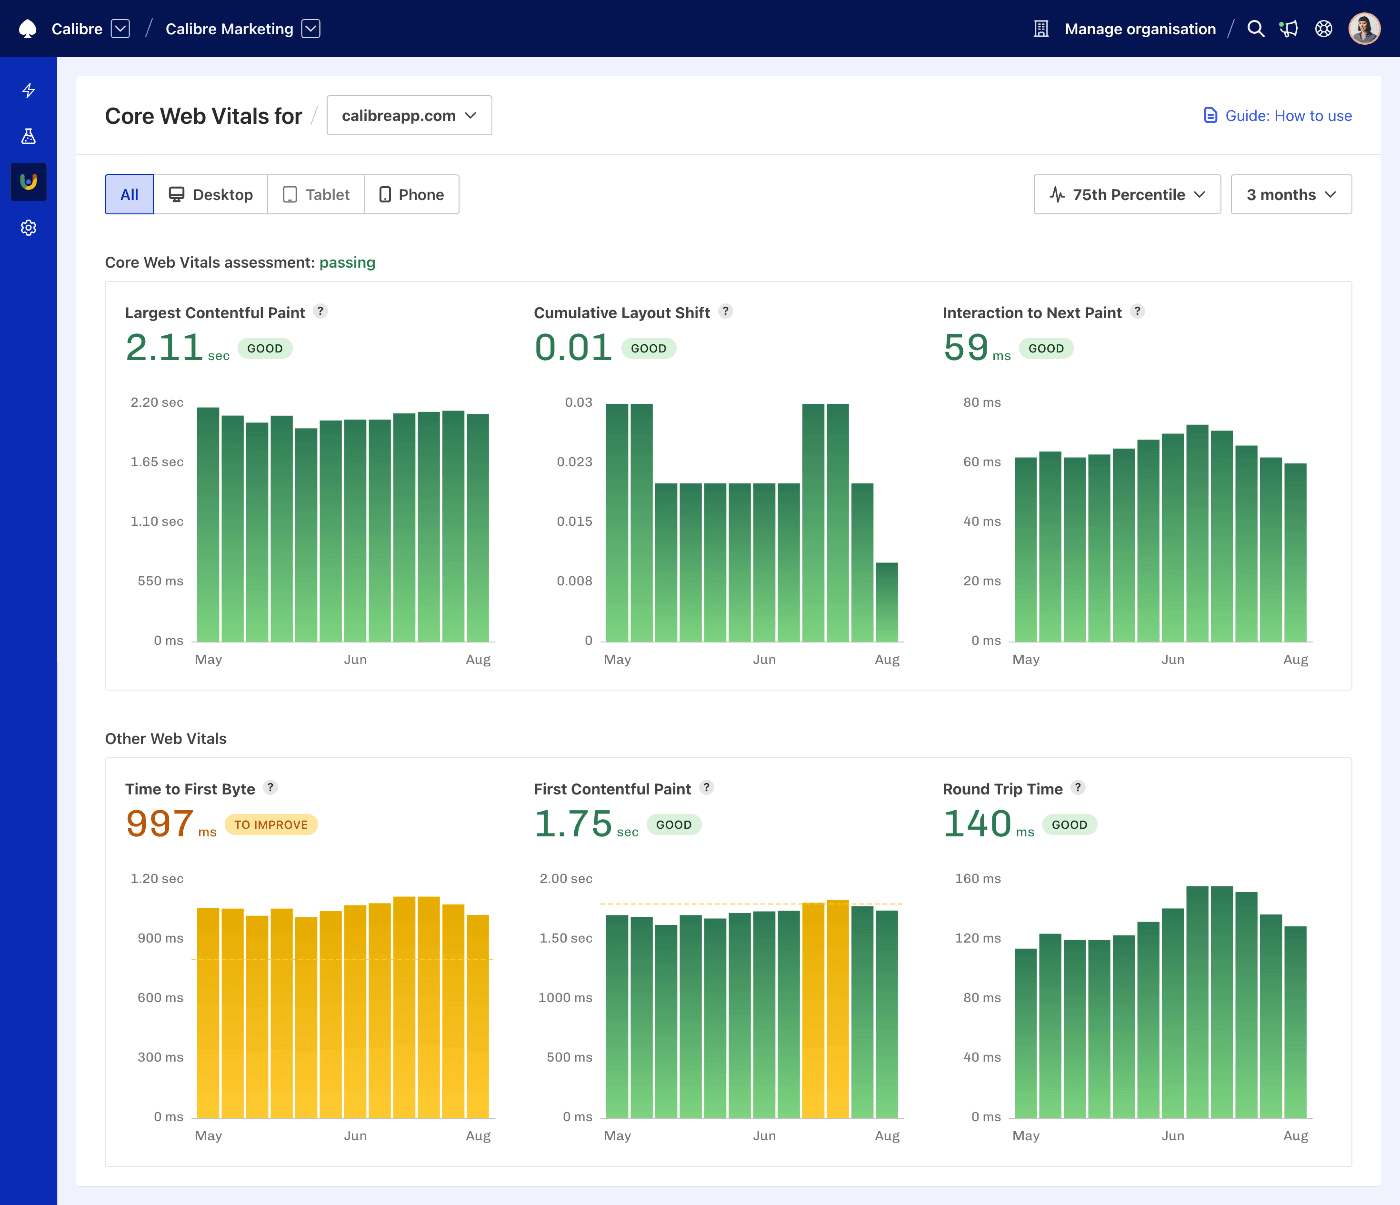
The CrUX Dashboard provides visualisation of real user data sourced from Google’s Chrome User Experience Report (CrUX) API. CrUX provides this data without requiring the addition of any tracking scripts to your site or application, and is also used as a ranking signal for the Google Search algorithm. CrUX serves as a foundational alternative to setting up real user monitoring.
To view, navigate to Site → CrUX → Dashboard.
Sites have to fulfill CrUX eligibility criteria to exist in the Chrome User Experience Report dataset. If the eligibility criteria are not met, the CrUX Dashboard in Calibre won’t display any data.
The CrUX Dashboard is automatically created for every Site tracked in Calibre. Reports are generated for a Site’s overall origin1 data, along with individual reports for each Page. Pages are automatically discovered by Calibre’s web spider.
View your CrUX Dashboard
- To view the CrUX Dashboard for your Site, go to Site → CrUX → Dashboard.
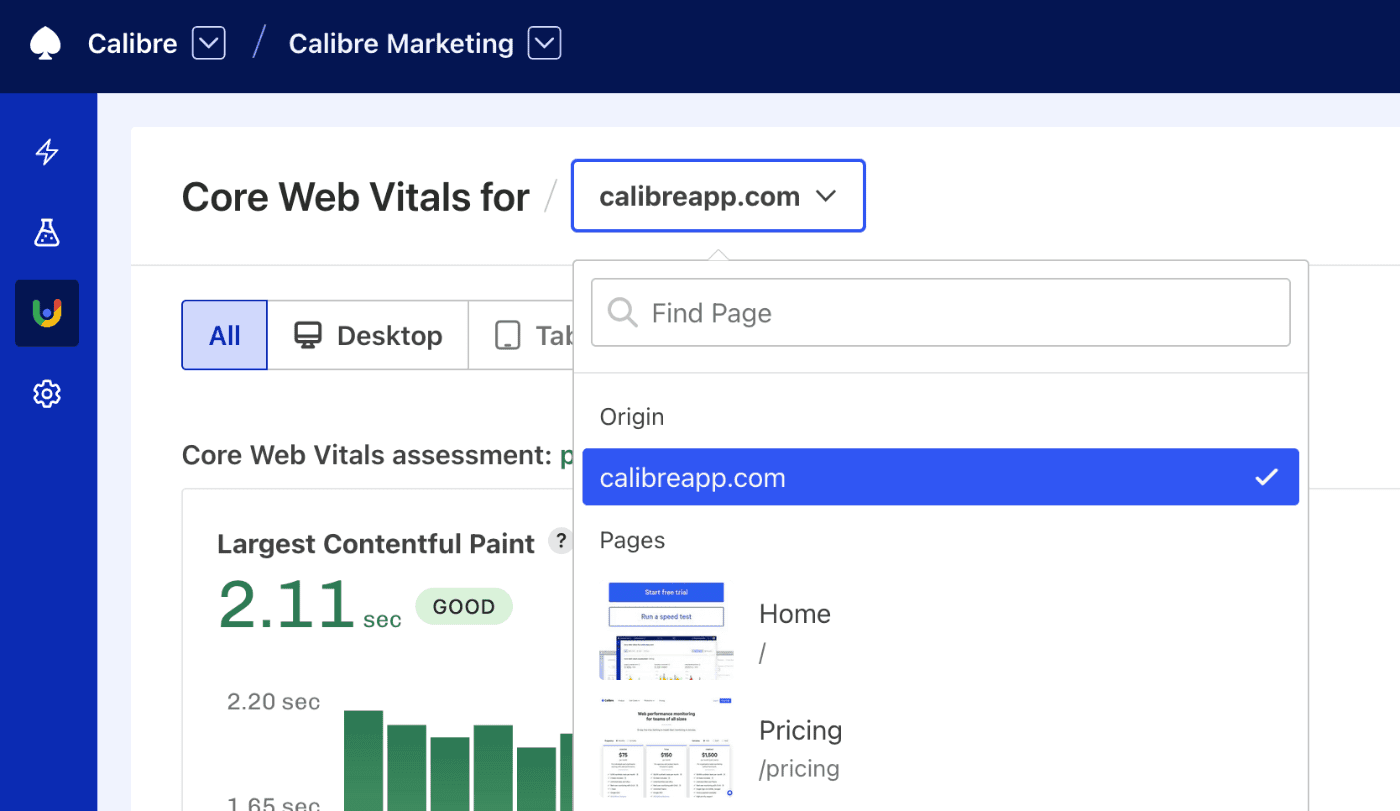
- View the Site’s origin report, or select a specific Page from the Origin/Page Dropdown.
- Filter by device type to find performance issues in specific environments.
- Change chart type to analyse metric trends or check if majority of sessions have good performance.

The CrUX Dashboard shows real-user session data for the following Core Web Vitals and Web Vitals data:
- Largest Contentful Paint
- Cumulative Layout Shift
- Interaction to Next Paint
- First Contentful Paint
- Time to First Byte
- Round Trip Time
All metric values and bar charts are colour-coded based on their value and status, so you can easily assess where to focus:
- Green: Good
- Yellow: To improve
- Red: Poor
The dashboard also provides an overall Core Web Vitals assessment with the following options:
- failing: when at least one Core Web Vitals value is within the poor or to improve threshold.
- passing: when all Core Web Vitals values are within the good thresholds.
- not assessed: when a site cannot be assessed due to lack of data.
Switching between origin and Page reports
The Crux Dashboard defaults to displaying origin1 report data, however reports can also be loaded for specific Pages via the Origin/Page Dropdown:

- Origin: This default option allows you to view aggregated CrUX data for an entire Site based on the Site’s Canonical URL1, including pages that have not been individually discovered.
- Page: Individual reports are available for all pages that Calibre has automatically discovered, noting that each individual page is subject to CrUX's eligibility criteria.
Filter by device type
To explore how Core Web Vitals measurements change depending on the device used, choose a type from the following options:
- All (aggregate of all devices)
- Desktop
- Tablet
- Phone
It’s possible that data for a selected device is not available for a given site in the CrUX API. If the data is available, Calibre will display the percentage of contributing sessions for each device type when hovering over the filter element.
Change chart type
Depending on what your goal is, you can switch between two types of visual representation:
- 75th Percentile: a bar chart portraying how the P75 value for each Core Web Vital metric changed over time. This mode is useful for analysing trends.
- Experience Distribution: a stacked bar chart portraying the proportion of good, poor and needing improvement user experiences. This mode is useful in analysing if the majority of sessions happen without performance issues.
- Metric Subparts: a bar chart showing the individual timings that make up the Largest Contentful Paint metric, useful for understanding which part of LCP is causing delays.
Each bar in both types of charts represents a week of data collection period, and is updated weekly.
On this page