The Third Party report helps uncover the impact of third party code, services and tools on performance and user experience. Third Party reports are available for each Snapshot test taken for a Site. This article explains how to access and analyse Third Party reports.
View Third Party reports#
- Navigate to a selected Snapshot → Third Party tab.
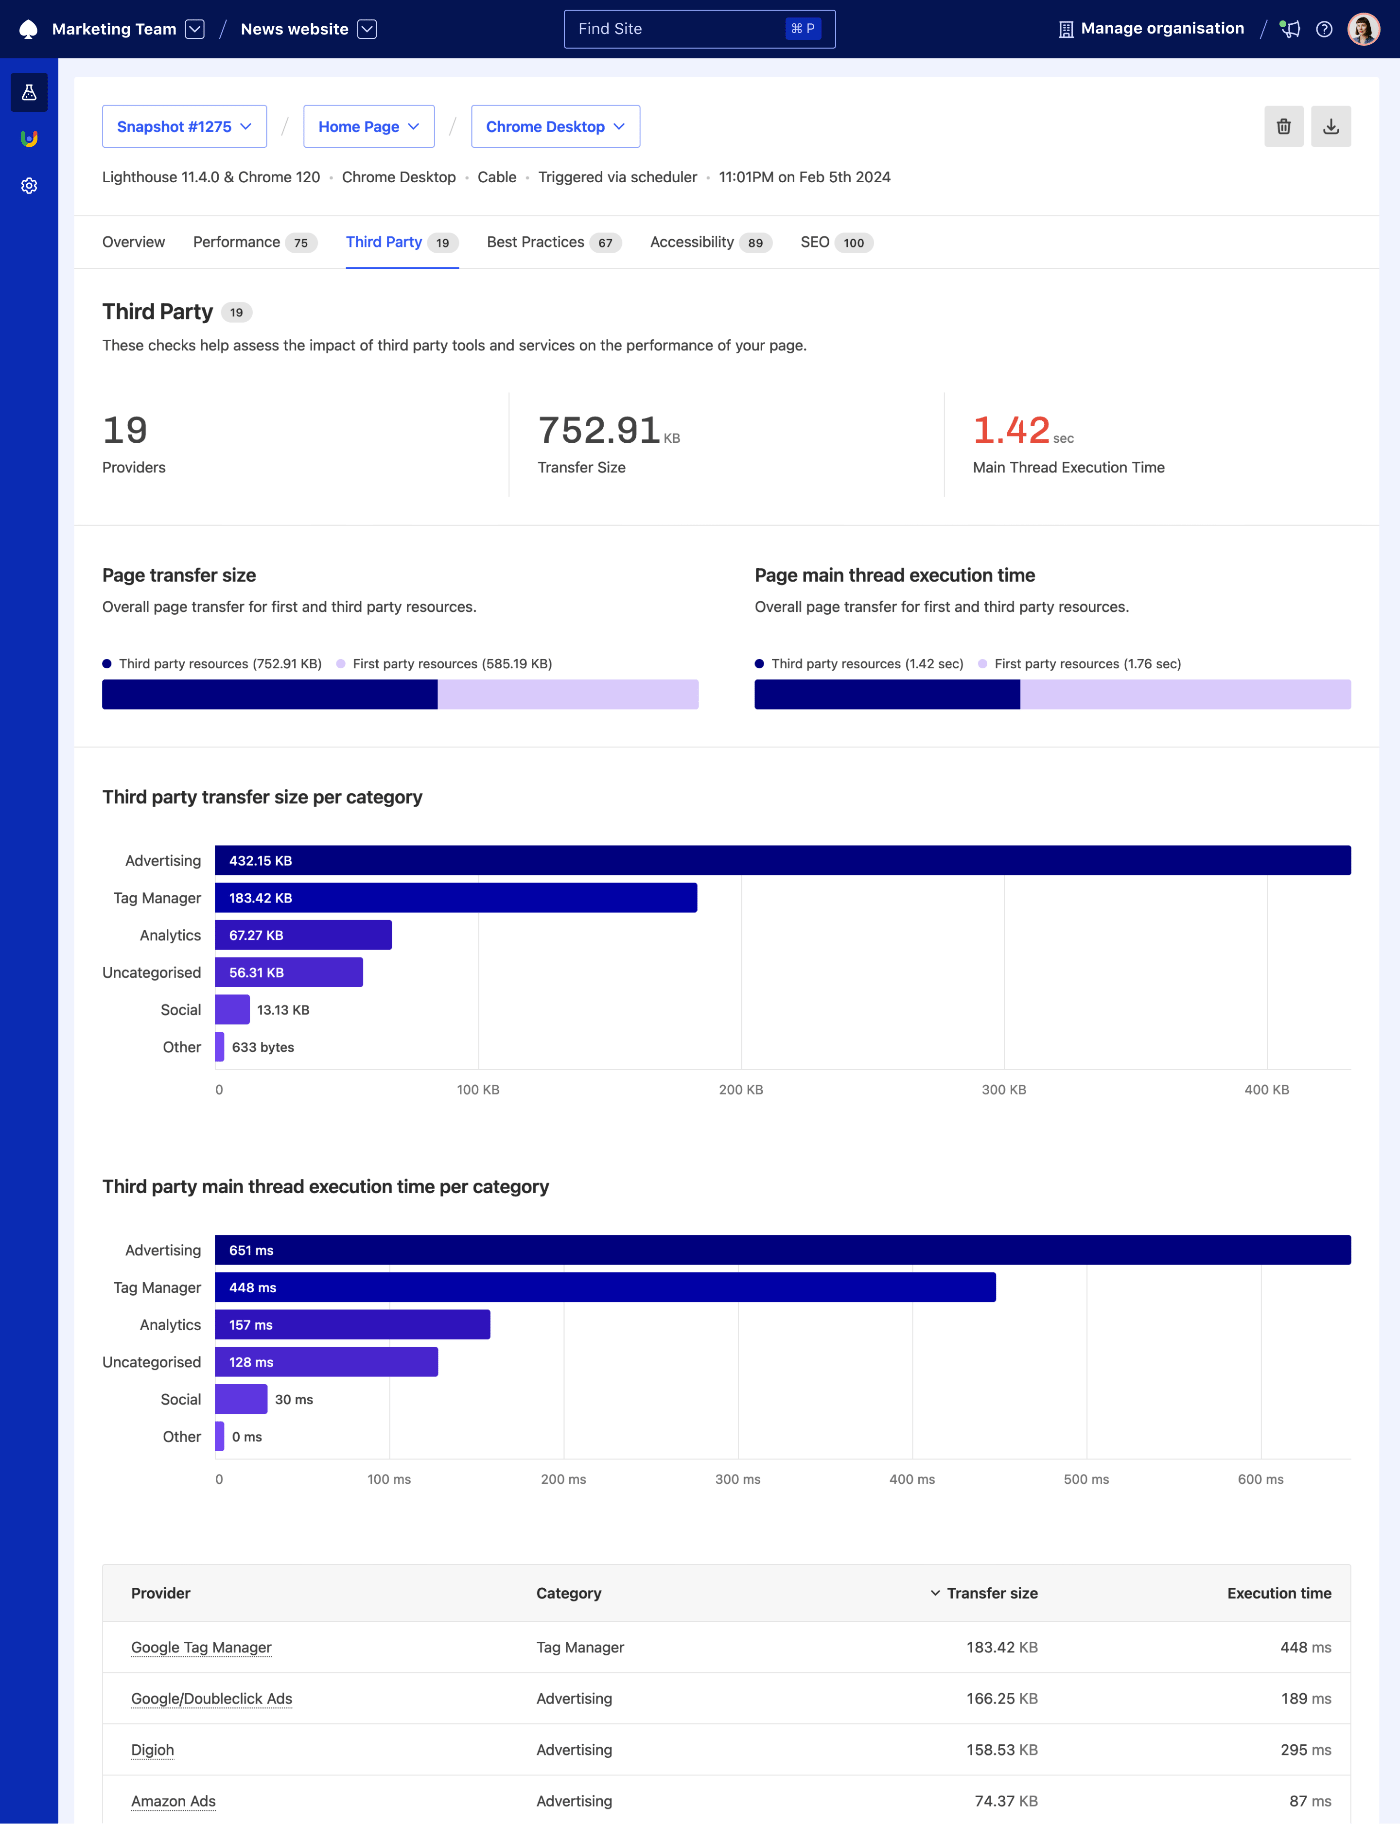
- Inspect which categories of tools take up most bandwidth and which providers are the worst performance offenders. You can sort third parties by provider, category, transfer size and execution time in the table at the end of the report page.
Each report highlights the number of detected providers, how they contribute to page transfer size and JavaScript main thread execution time and what is the split between first and third party transfer size and main thread execution time.
Track changes in Third Party metrics#
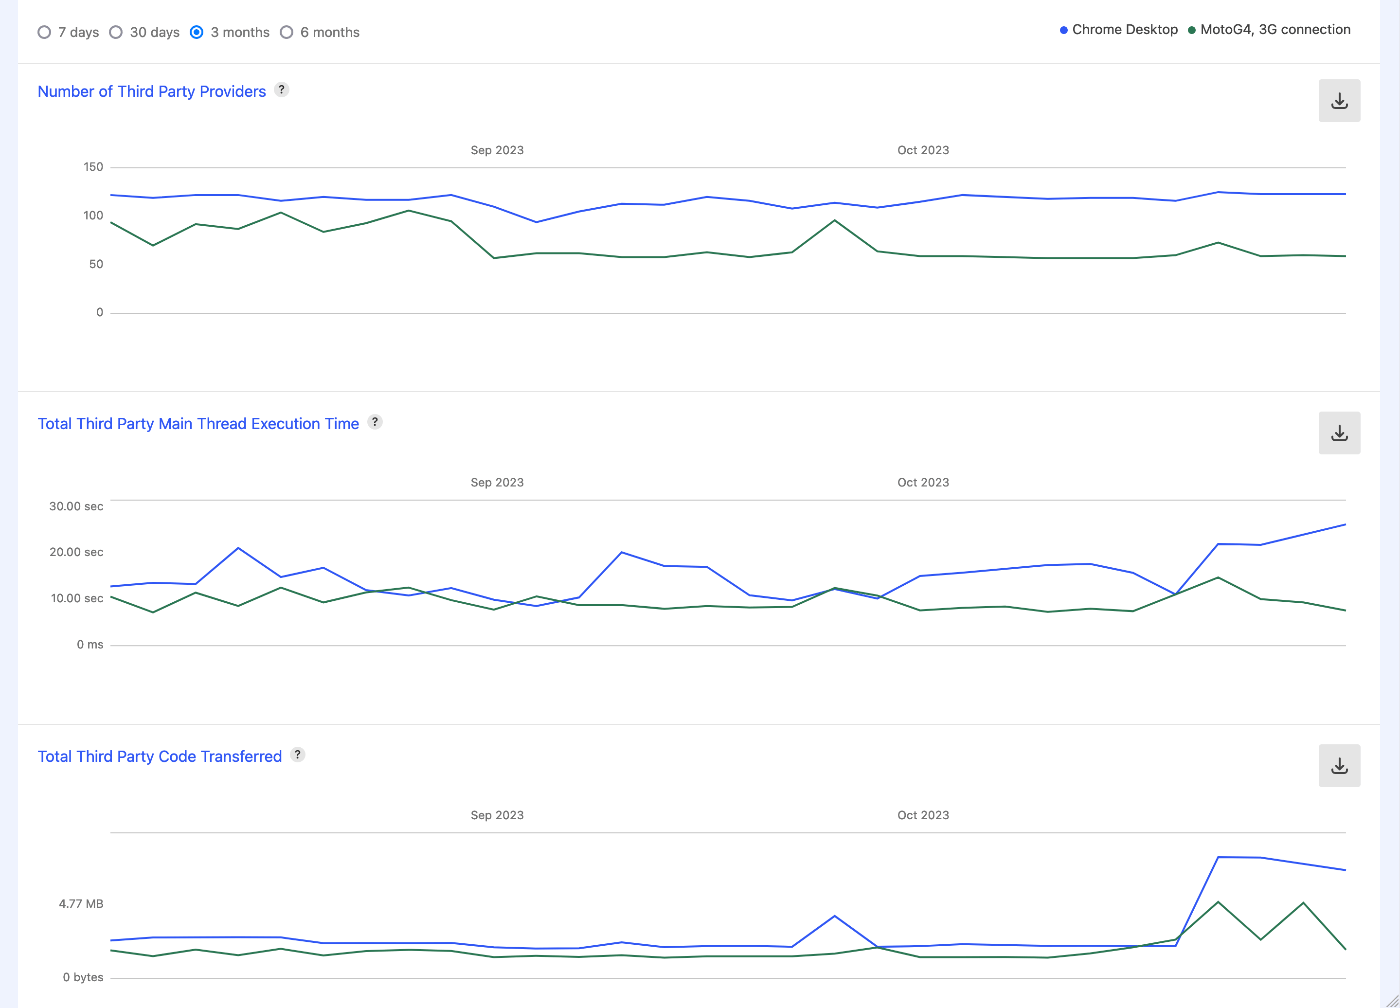
Third Party metrics behave like any other metric tracked in Calibre. You can keep an eye on changes to third party-related metrics over time on Pulse report, Pages Leaderboard or set Budgets against them.
Block Third Parties in Test Profiles#
To benchmark the impact of third parties and find better alternatives, you can turn off selected providers in Test Profiles.