JavaScript task execution is the source of the biggest and most common performance bottlenecks. Avoiding long-running tasks and blocking the JavaScript main thread is one of the most critical performance strategies to employ.
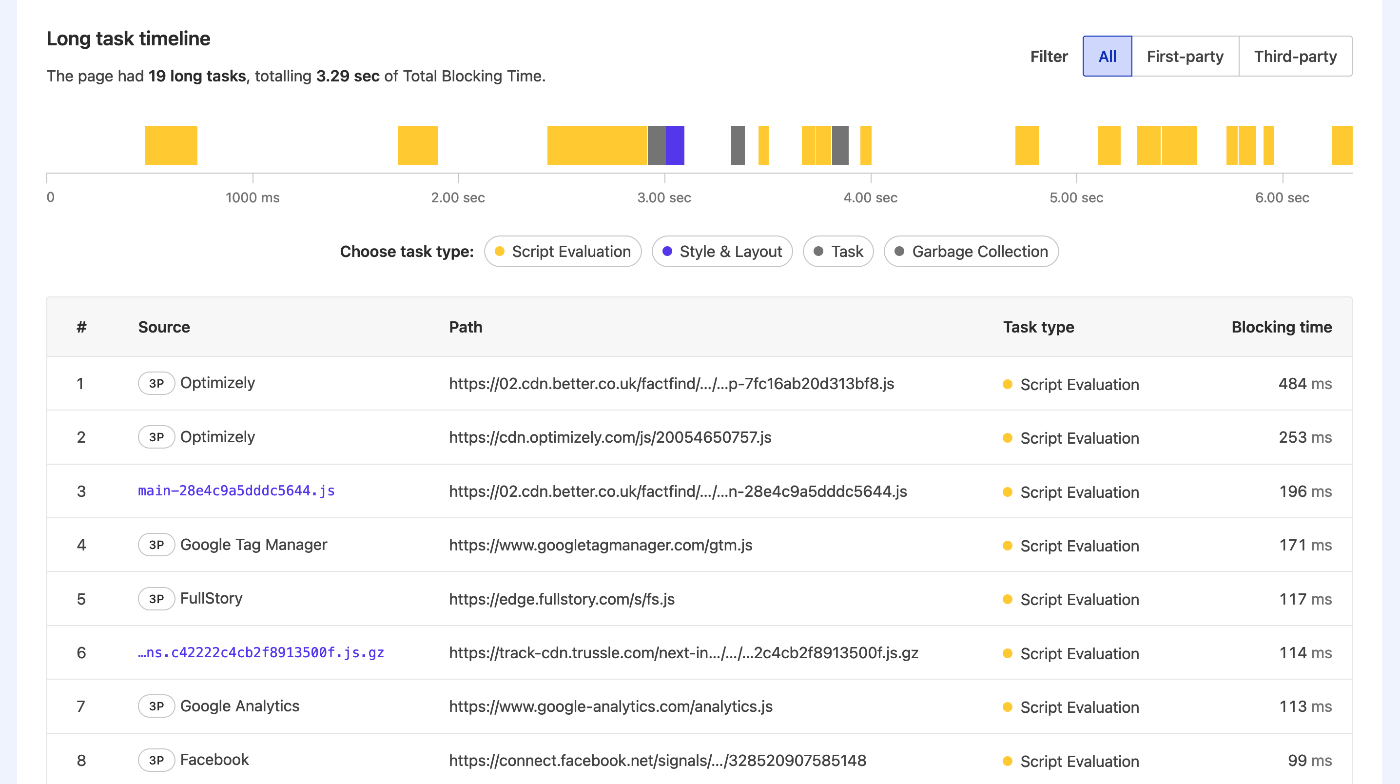
The Long Task Timeline, found on the Snapshot Overview and Single Page Tests pages, helps you identify long tasks that took more than 50ms to execute during page load. Calibre showcases both parent and children tasks that contribute to a long task warning, so you can identify which specific task causes the most issues.

Each task is classified as one of:
- Script evaluation
- Style & Layout
- Task
- Garbage collection
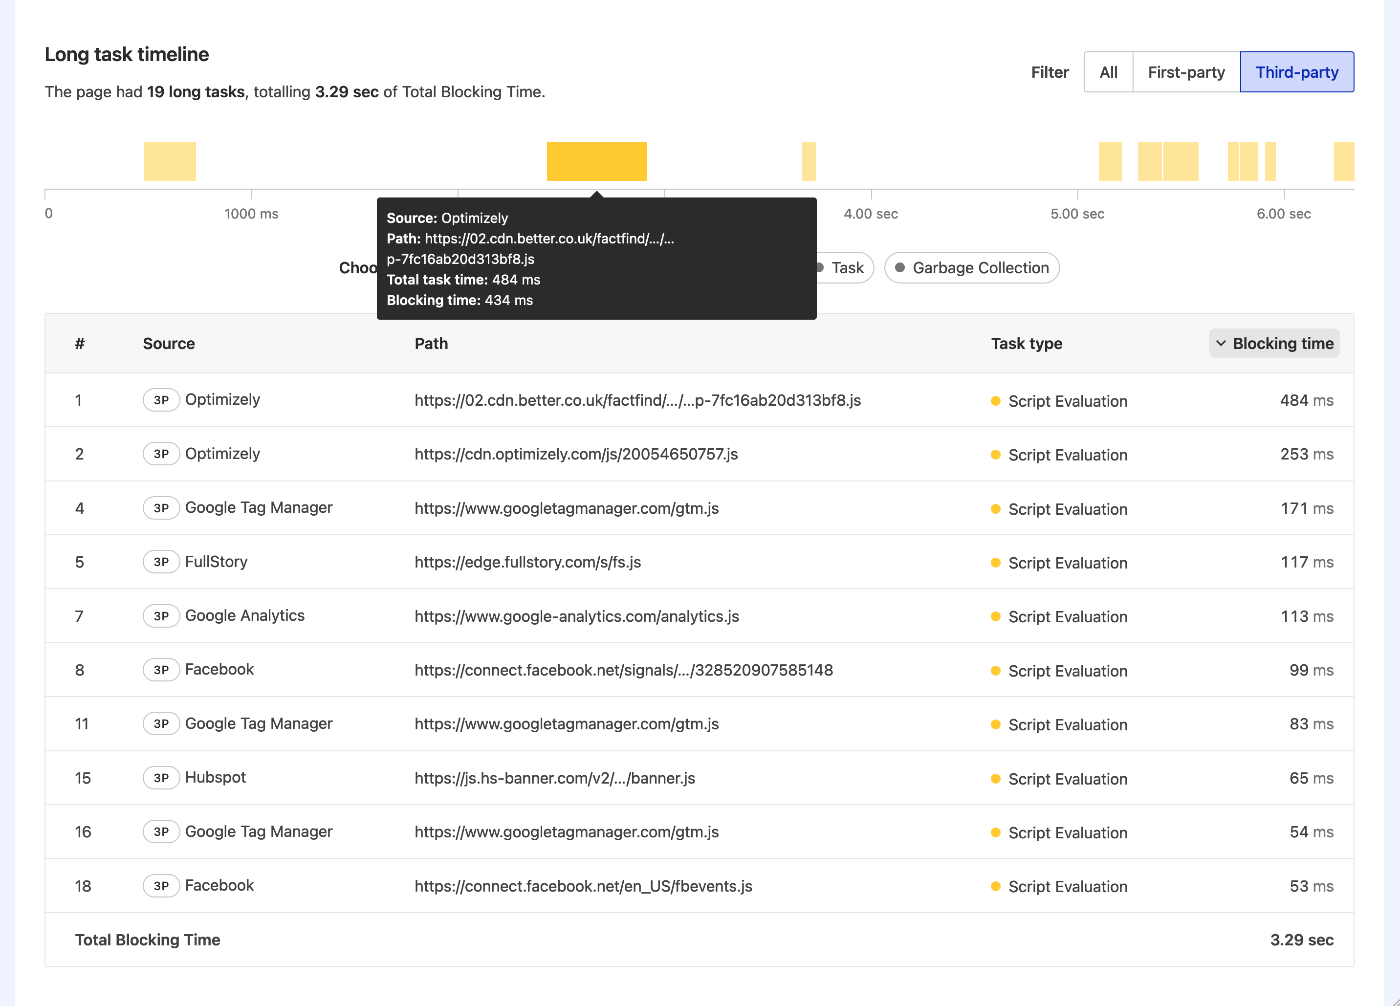
Hovering on a task presented in the chart will show:
- Source (a specific third party or a file)
- Path (to the script file)
- Total task time
- Blocking time (contributing to Total Blocking Time calculation)
Filter by first and third-party scripts#
The Long Task Timeline can be filtered by first and third-party tasks, which makes it easy to determine which internal scripts or external tooling contributes to slowing the execution of the page.
The chart below illustrates filtering set to third-party tools, which shows a total 3.29s contribution to Total Blocking Time.
