Image Actions, our GitHub Action for automatically compressing images in your Pull Requests, is now using the main branch instead of master.
To avoid breakages in the workflow, update your configuration file to mention the main branch.
Image Actions, our GitHub Action for automatically compressing images in your Pull Requests, is now using the main branch instead of master.
To avoid breakages in the workflow, update your configuration file to mention the main branch.
You can now also add global Headers and Cookies to manage how Calibre’s Test Agent accesses your Sites. Previously, this option was only available through Test Profiles. Now, you can use global Headers and Cookies for Site-wide settings, and Test Profiles for more targeted testing, such as A/B tests for specific devices.
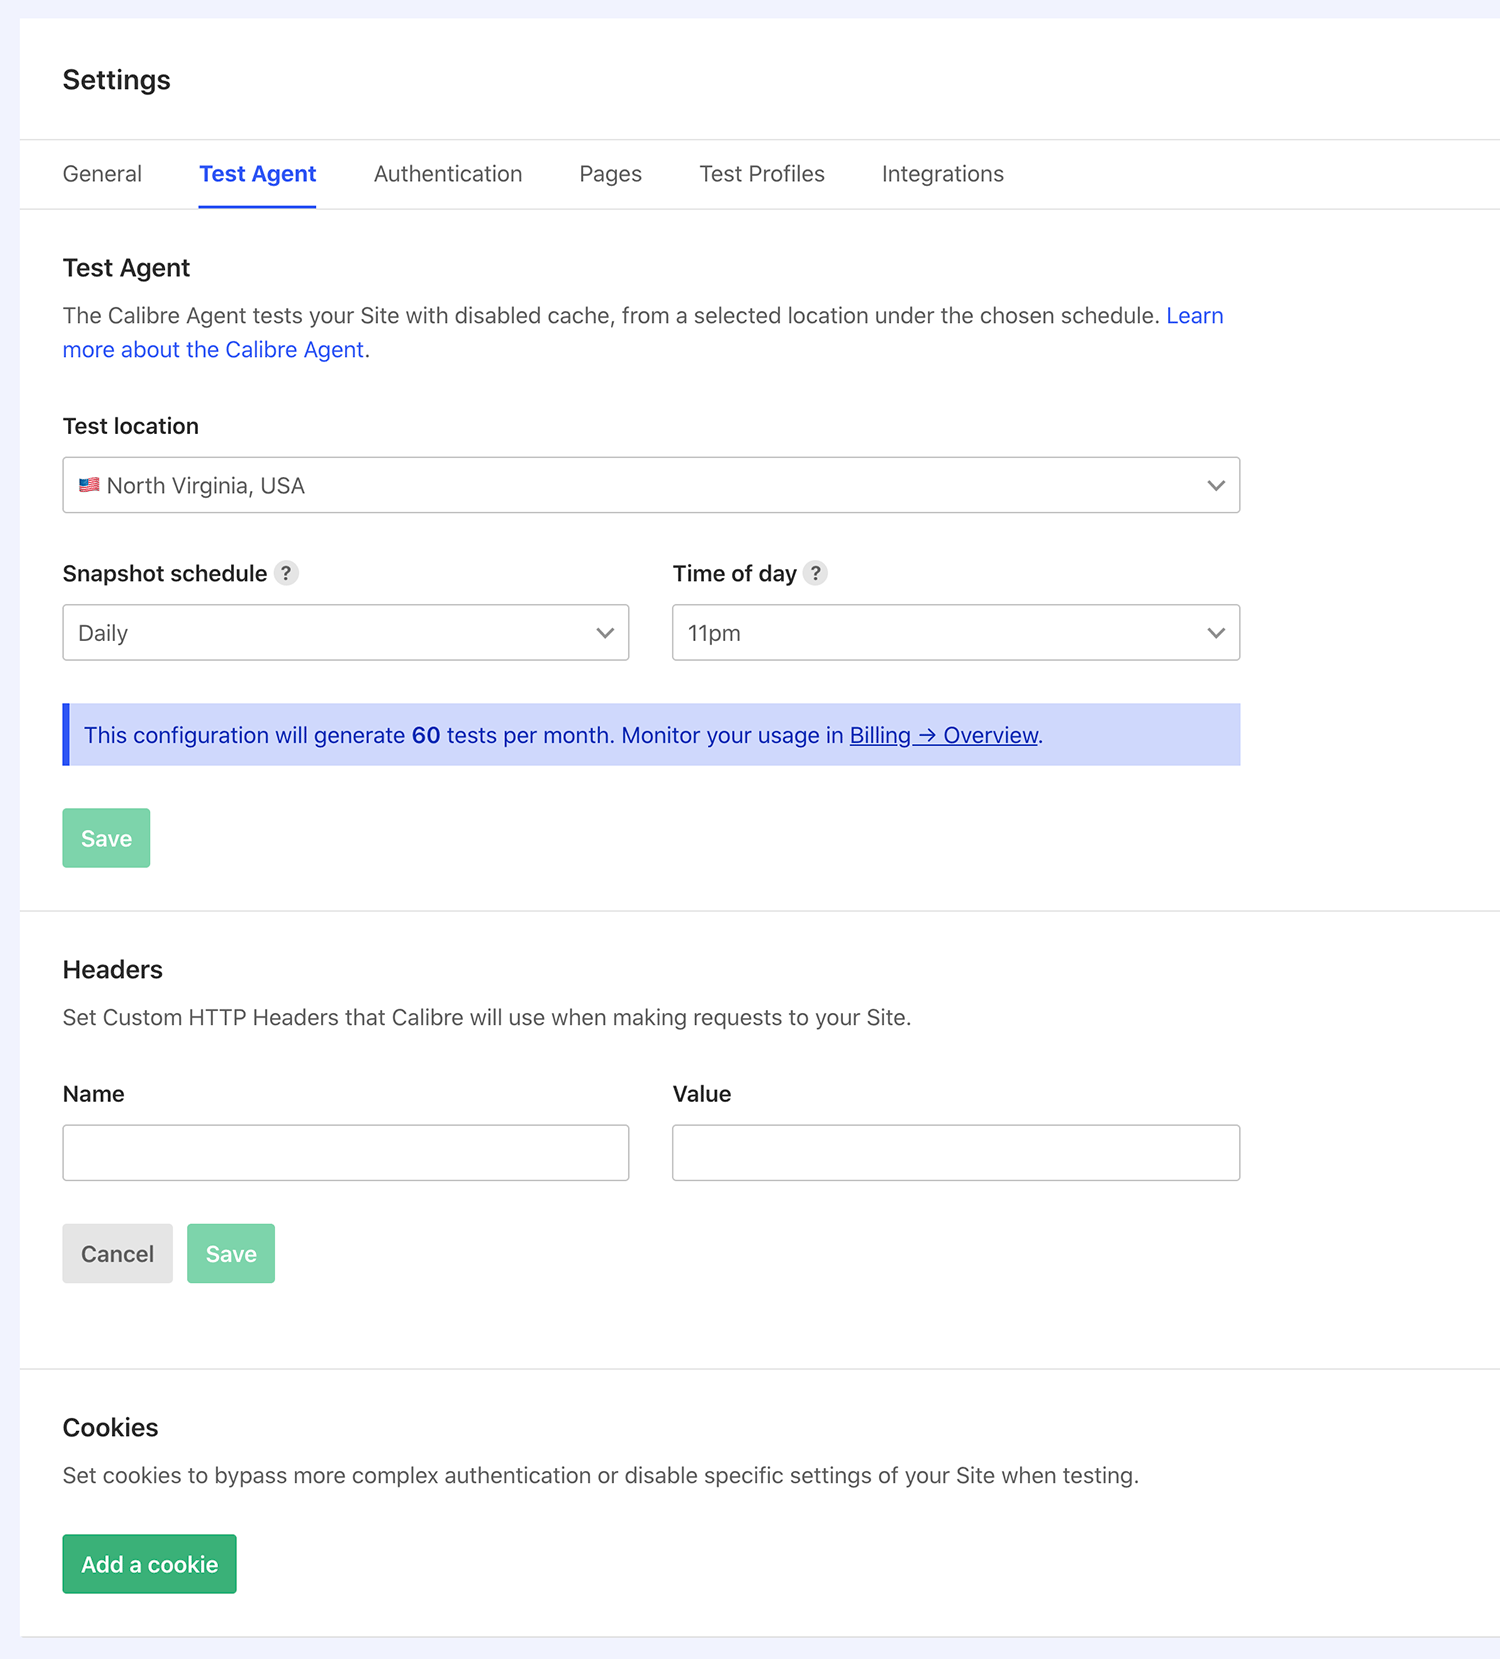
Use global Headers and Cookies to run Site-wide tests with custom authentication and settings.
Our Test Agents now use the latest Lighthouse release, 6.4.0. As always, we upgrade to stable Lighthouse releases as they become available so that you can leverage the newest version.
It’s a frustrating but not uncommon for Lighthouse performance tests to fail. We introduced Compatibility Mode to provide you with critical performance metrics even when Lighthouse returns an error, which otherwise would yield no results.
There are several compatibility modes, which will be triggered depending on encountered types of failures in testing. In all scenarios, you will receive performance metrics, but might not be able to see complimentary audits. Learn more about the difference between Standard Mode, Reduced and Minimum Audits.
We refreshed the Site Settings area so that you can set up and manage your testing faster. You can now search for Pages, which is especially helpful when working with larger Sites. You can explore available integrations in the Integrations tab, to connect Calibre to your favourite services and make the most out of your monitoring data.
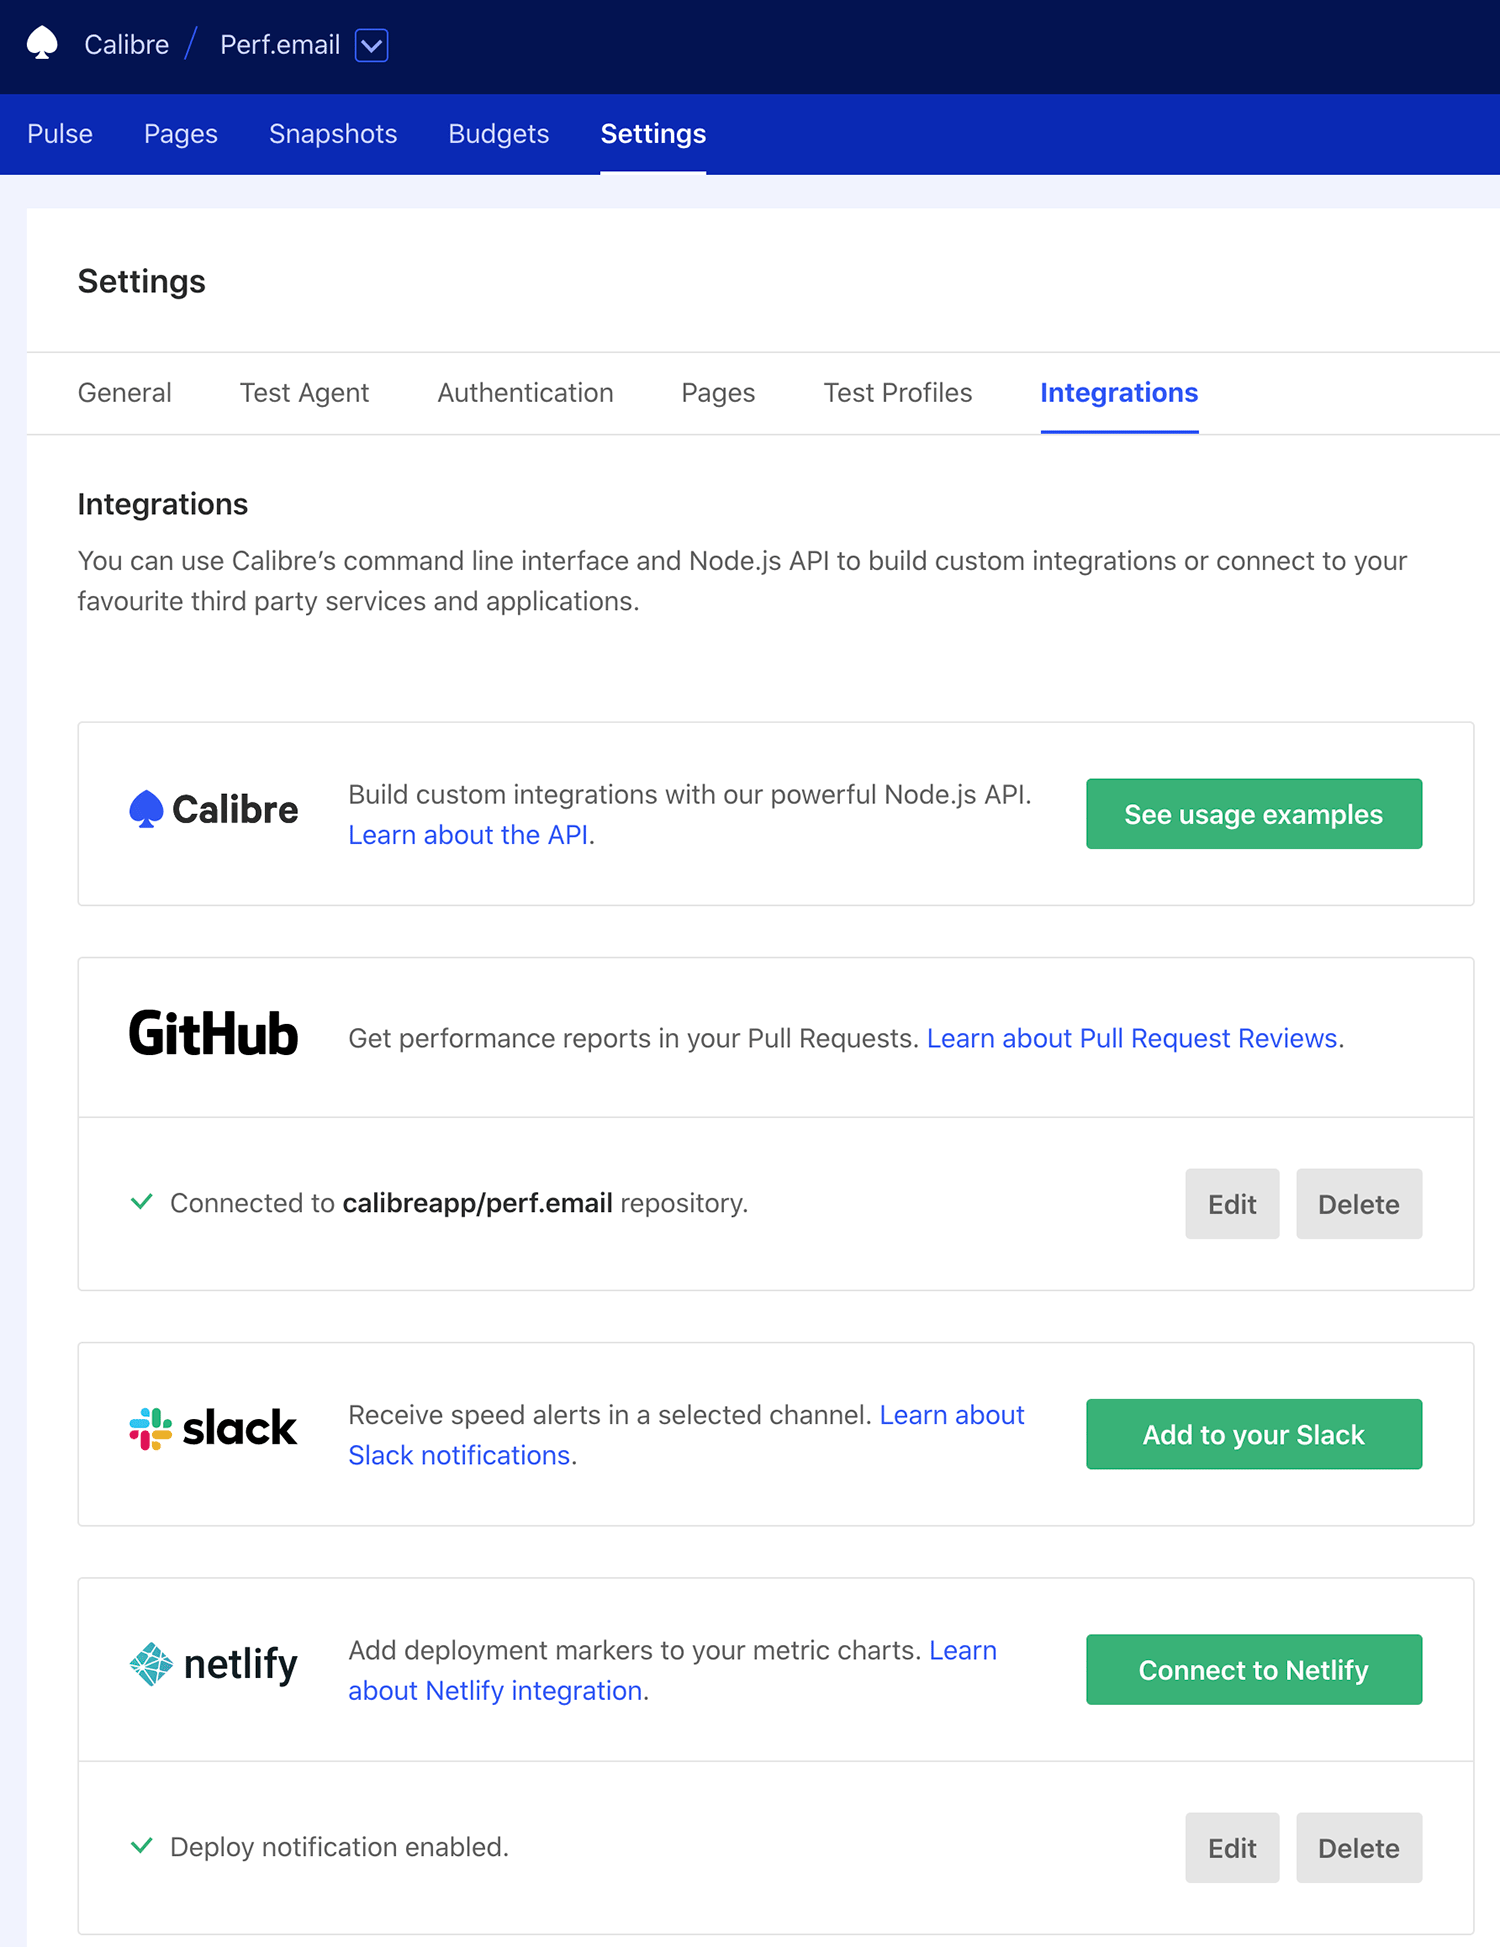
Enable and manage how Calibre connects to your favourite services to send notifications, monitoring data, add deploy information to charts and more.
See how to switch Sites quickly.
We redesigned the primary navigation to make it faster and more straightforward to get around Calibre. Now, you can quickly switch your viewing context between both organisations and Sites, as well as create new ones.
Image Actions, our Open Source GitHub Action that automatically optimises images in your Pull Requests, got a significant upgrade and can now be used with more complex workflows.
You can now see the difference in images pre and post-compression, run the optimisation on a selected schedule, run the action in compressOnly mode that allows for more complex combinations and more. Learn about all changes to Image Actions 2.0 here.
We exposed how long it takes for Calibre to test your Pages with Test Duration visible across the interface in the same way as any other trackable metric:
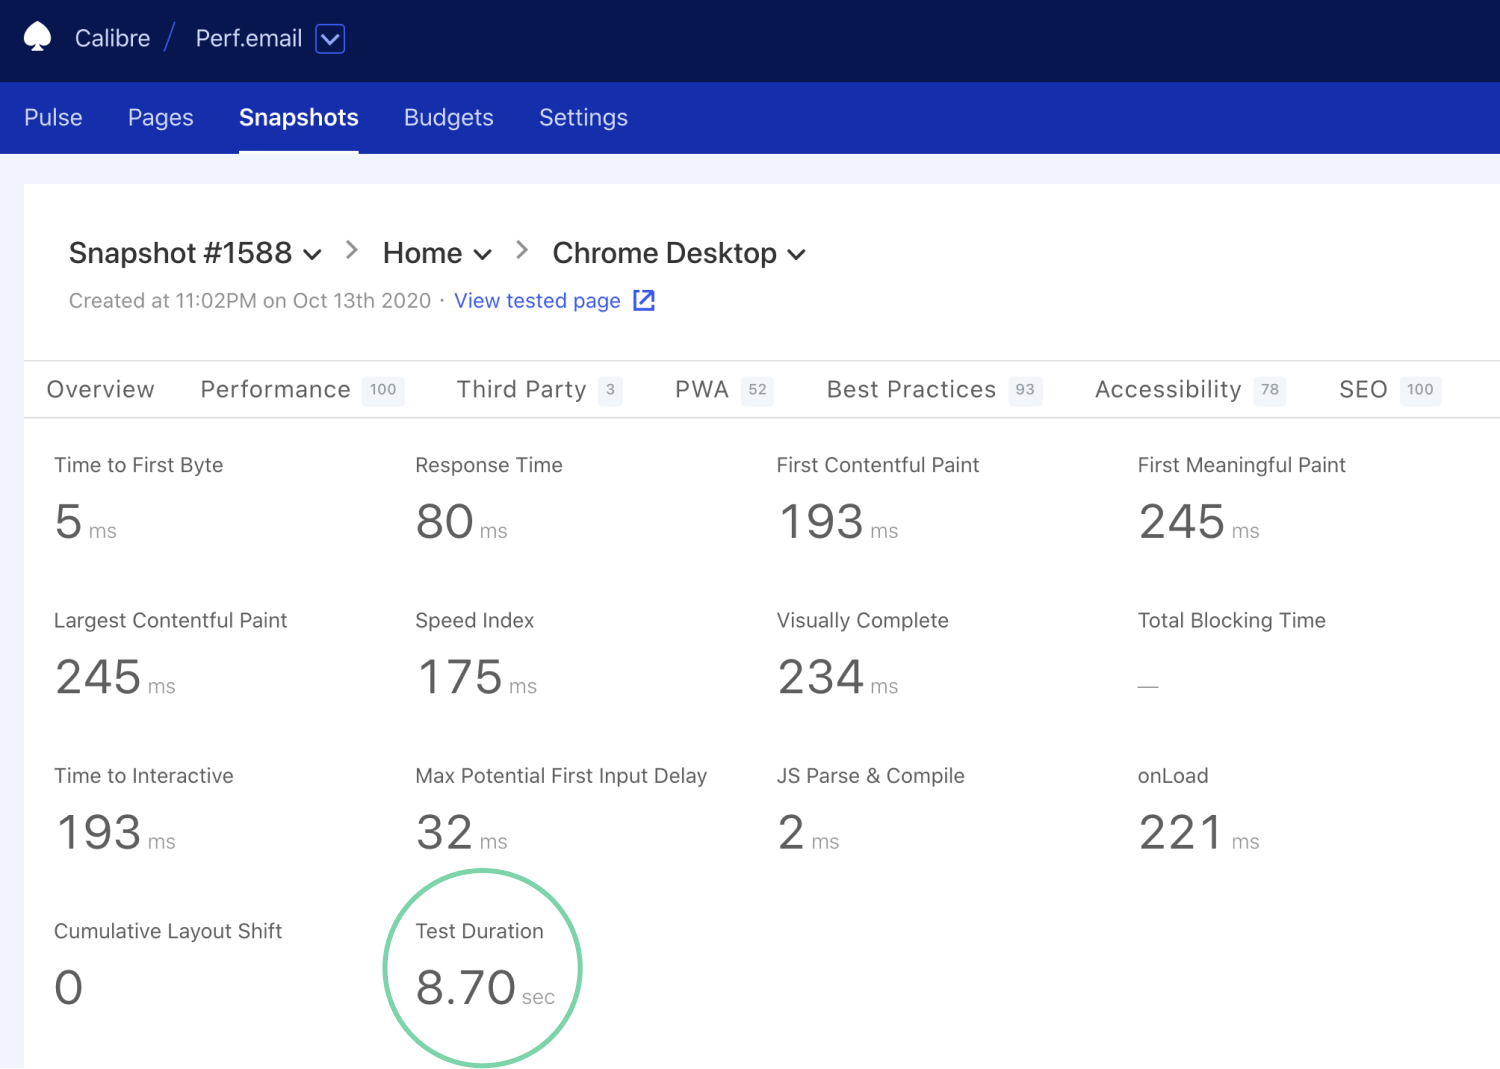
Test Duration portrays the duration of a singular test from its start to end.
When inspecting metric history charts on Pages Leaderboard and Budgets dashboard, you can now see corresponding deploys if you have enabled Deployment Tracking, are using the Netlify integration or Pull Request Reviews:
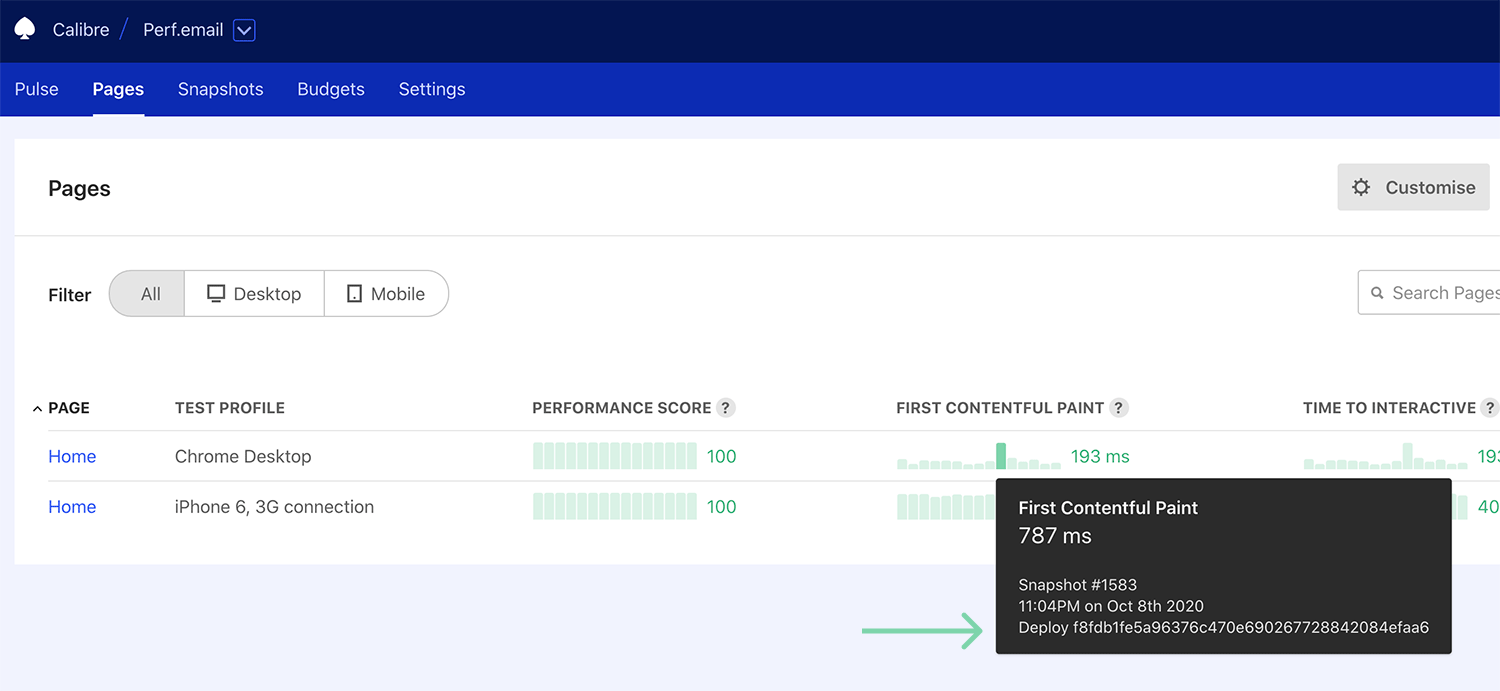
See corresponding deploys when exploring metric charts on Budgets and Pages Leaderboard.
This information should make it easier to identify potential spikes visualised in the bar charts. Click on an individual bar to inspect changes further in the Snapshot view.
We improved the structure of Lighthouse audits available in Performance, PWA, Best Practices, Accessibility and SEO tabs for each Snapshot. Now, all audits returned from Lighthouse fall within the following categories:
With improved categorisation, you can pinpoint which areas to focus on easier.
We launched Pages Leaderboard so you can identify fast and slow areas of your Sites quickly. In the Pages Leaderboard, you can sort Pages within your Sites based on three selected metrics and device type (desktop or mobile). Calibre will show the last 15 measurements for each metric in your Pages dashboard, colour-coded based on recommended value ranges, so you know which areas need improvements most.
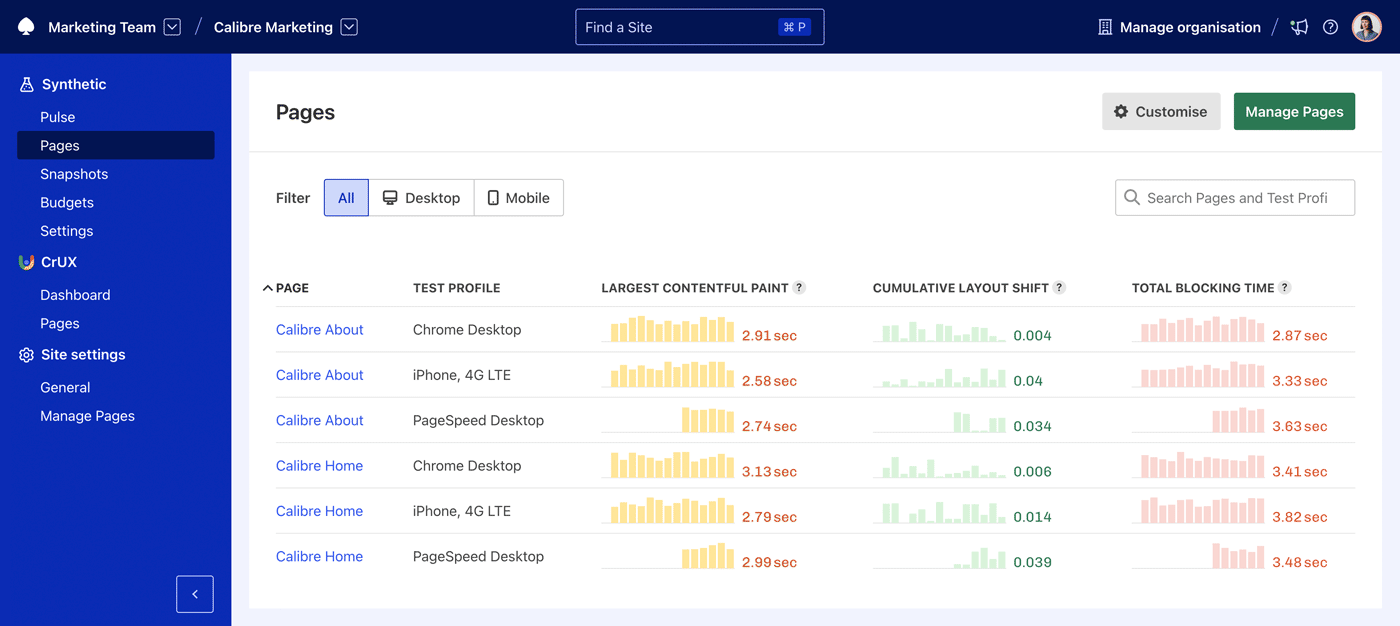
We encourage customising metrics based on your organisational or project goals. For example, you might be wanting to focus on Core Web Vitals. You can also use the Pages Leaderboard for competitive benchmarking, by tracking your landing pages against competitors. With sorting and filtering, you can easily rank Pages against each other.
Learn more about the Pages Leaderboard in the announcement post and our documentation.
Our Test Agents now use the latest Lighthouse release, 6.3.0. As always, we upgrade to stable Lighthouse releases as they become available so that you can leverage the newest version.
There’s a variety of reasons why tests might not be completed successfully—from networking, firewalls, HTTP responses, incorrect markup to timeouts caused by poor performance. Ideally, we spot and address persistent failures quickly, so there’s no disruption to our monitoring and data.
For that exact reason, we introduced Snapshot Failure Emails that alert you when tests are not completing. We will also let you know when tests are running smoothly again.
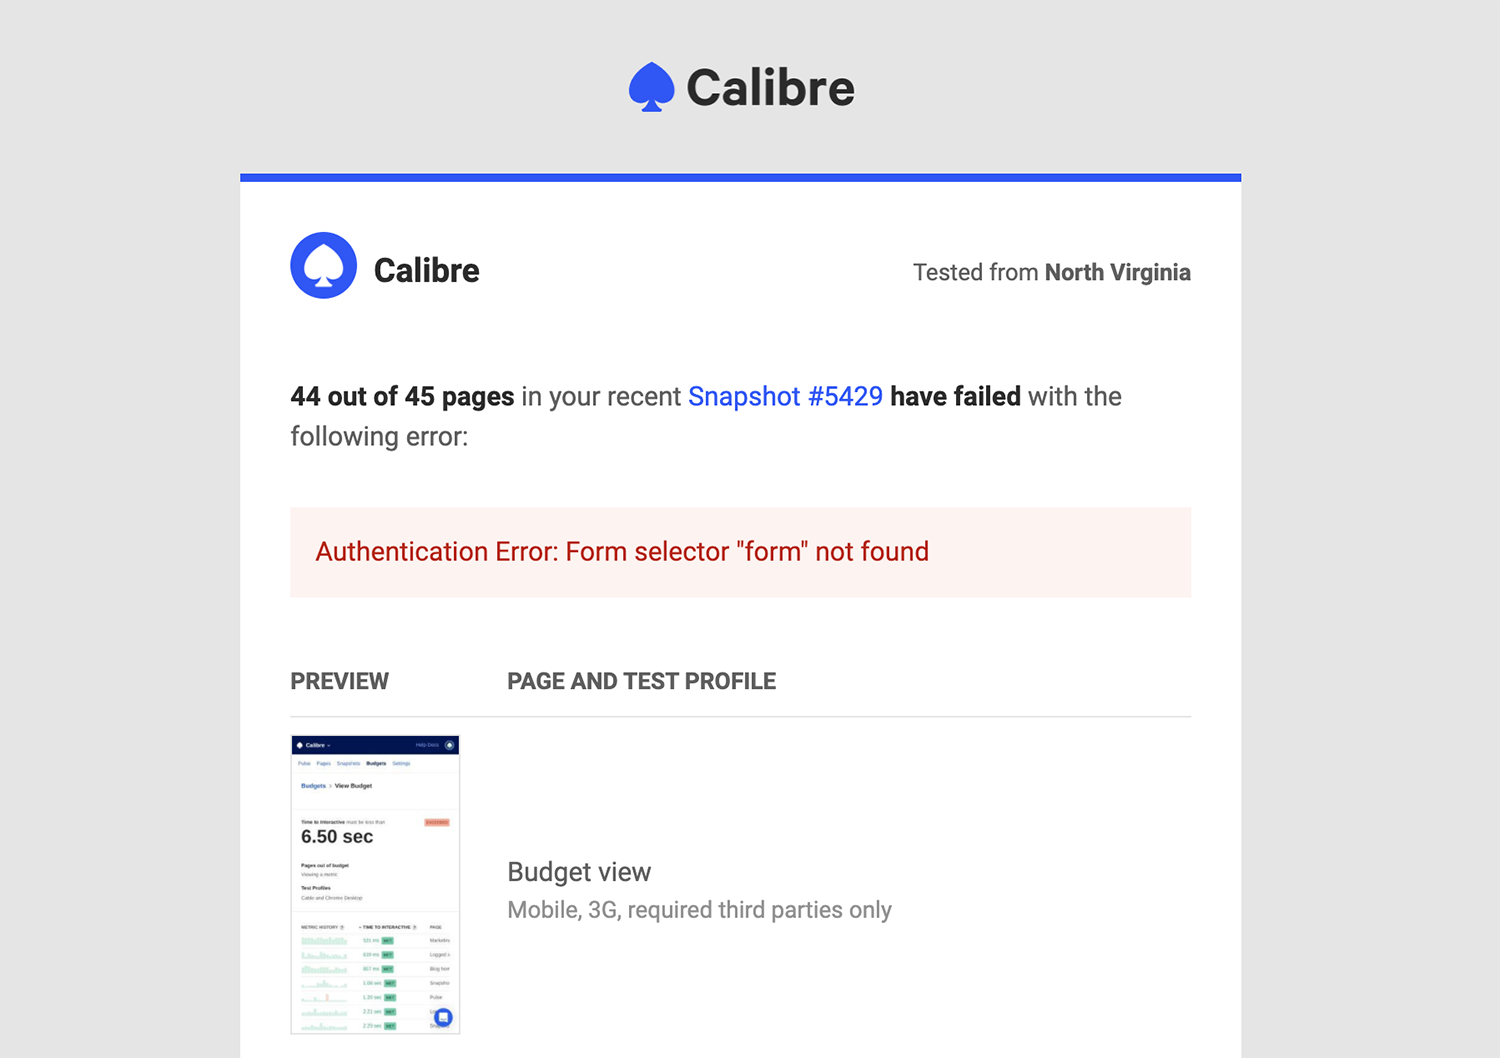
See detailed information about why your test might not have completed successfully.
Anyone can subscribe to Snapshot Failure alerts in Profile → Email Notifications. In case you didn’t see it, we also documented the most common test error types, so you can debug the reasons behind failures more quickly, too.
Our Test Agents now use the latest Lighthouse release, 6.1.1. As always, we upgrade to stable Lighthouse releases as they become available so that you can leverage the newest version.
If you’re testing Sites that require authentication, you can do so without providing the username and rely solely on the password. We know authentication comes in various shapes and forms, thus providing the username to the Calibre Test Agent is now optional.
You can always adjust your authentication settings in Site → Settings → Agent Settings.
Suppose you are using multiple deployment methods for GitHub repositories connected to Pull Request Reviews. In that case, you can now choose the provider that should be used as a basis for performance comparison.
Selecting a deployment provider when many are present will ensure the most accurate results in your performance reports. You can choose a provider in Site → Settings → Integrations → GitHub.
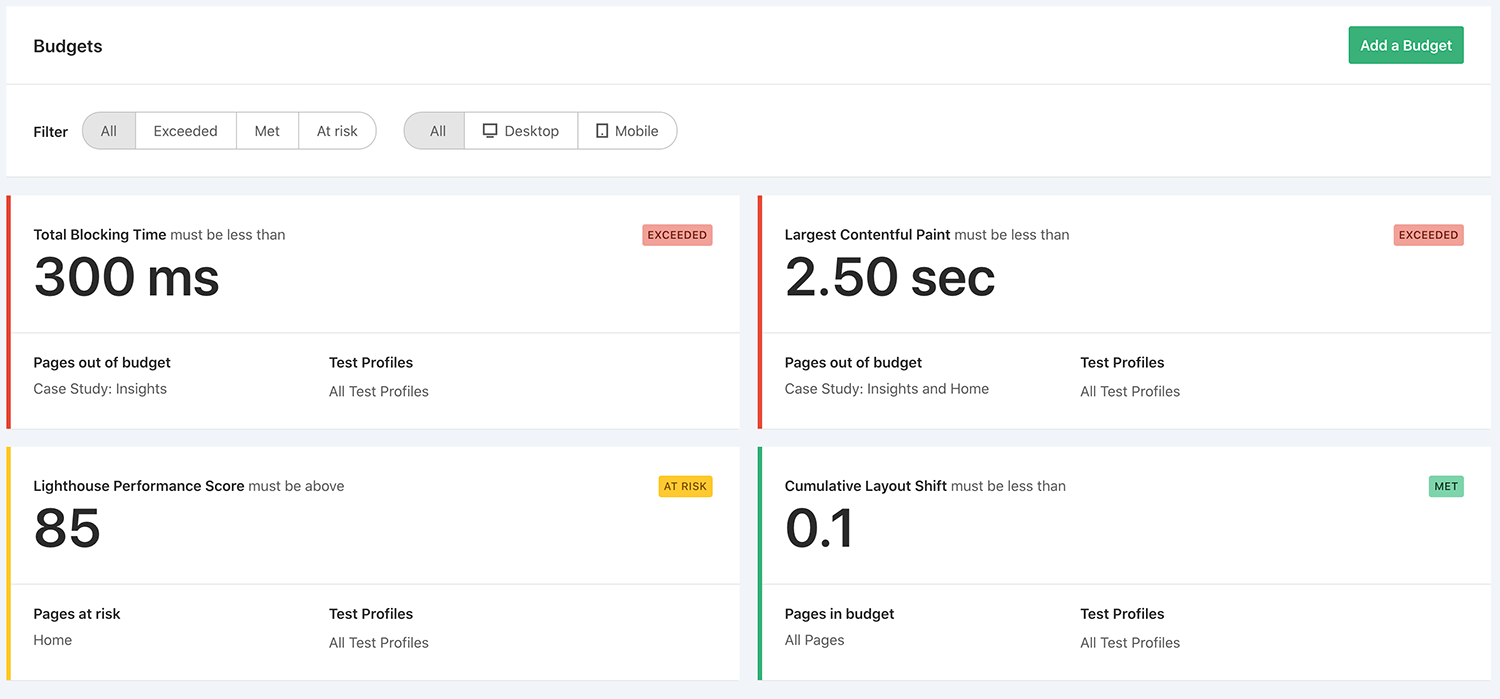
We completely revamped performance budgets to guide you in setting thresholds based on recommended values and your context. With new Budgets, you’re able to see all of your targets with their current status in one place—the Budgets dashboard.
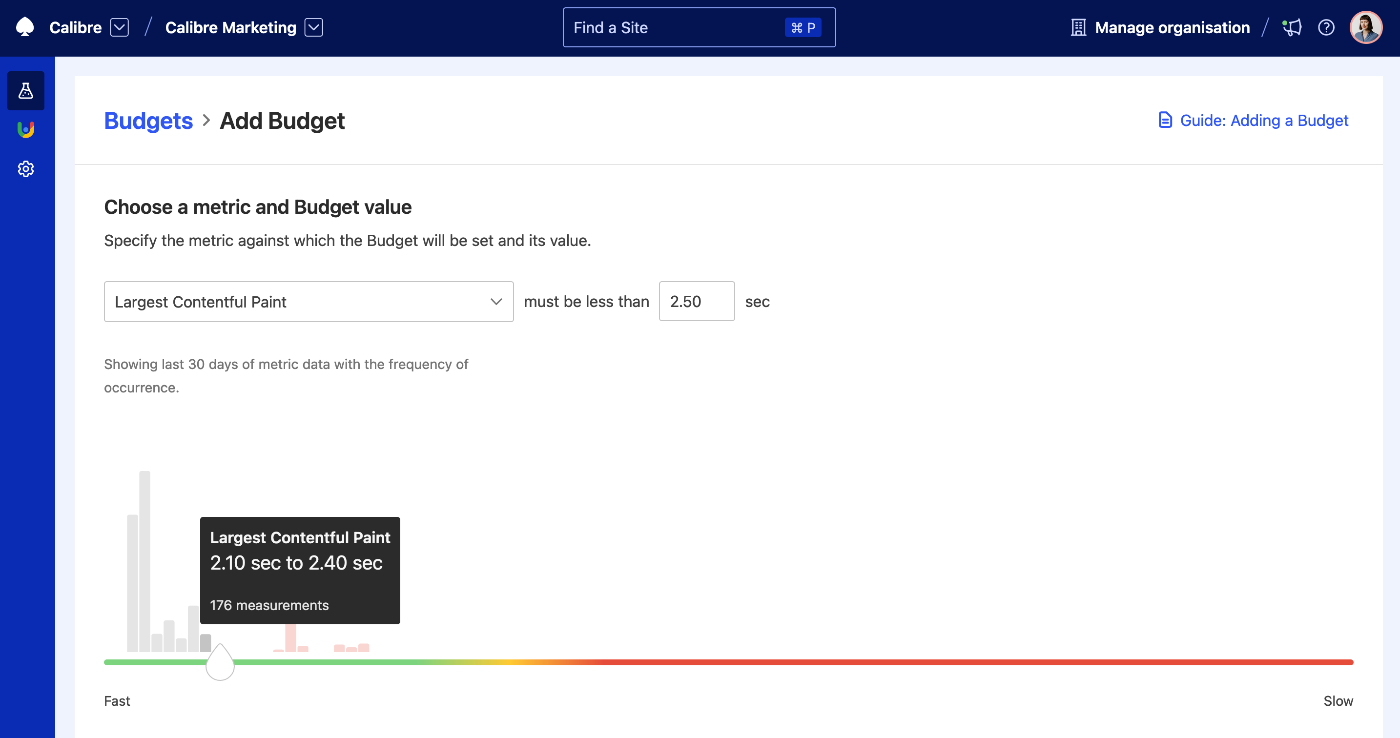
When creating a Budget, Calibre will now showcase the desirable value ranges alongside your past measurements. That way, you can make an informed decision about what’s achievable in the short term, and where would you like to be in the long term. We take out the laborious process of guessing what a good metric value should be.
You can also view your Budgets and see historical data for each Page and Test Profile combination. By doing so, you will be able to easily spot outliers that might need separate thresholds or identify where more performance work is required to meet your goals.
As always, Calibre will notify you about the status of your budgets through email and Slack, based on a selected frequency. In Budgets 2.0, we also identify at-risk values, so you know when a metric is close to exceeding the budget and can address it before it happens.
Read more about what’s new in Budgets and learn how to set them up.
If your deployment previews are password protected and you’re using Pull Request Reviews, you can now add authentication settings to your config.yml to access those environments. Those authentication settings will only be used for Pull Request Reviews tests. You can still specify separate authentication methods for your scheduled and API-invoked Snapshots.
On May 26, we updated our Test Agents to the latest version of Lighthouse. Lighthouse 6 comes with a completely revamped Performance Score algorithm, new metrics, audits, and more. All tests from May 26 onwards run using Lighthouse 6, which is why you are likely to observe changes to your Performance Score.
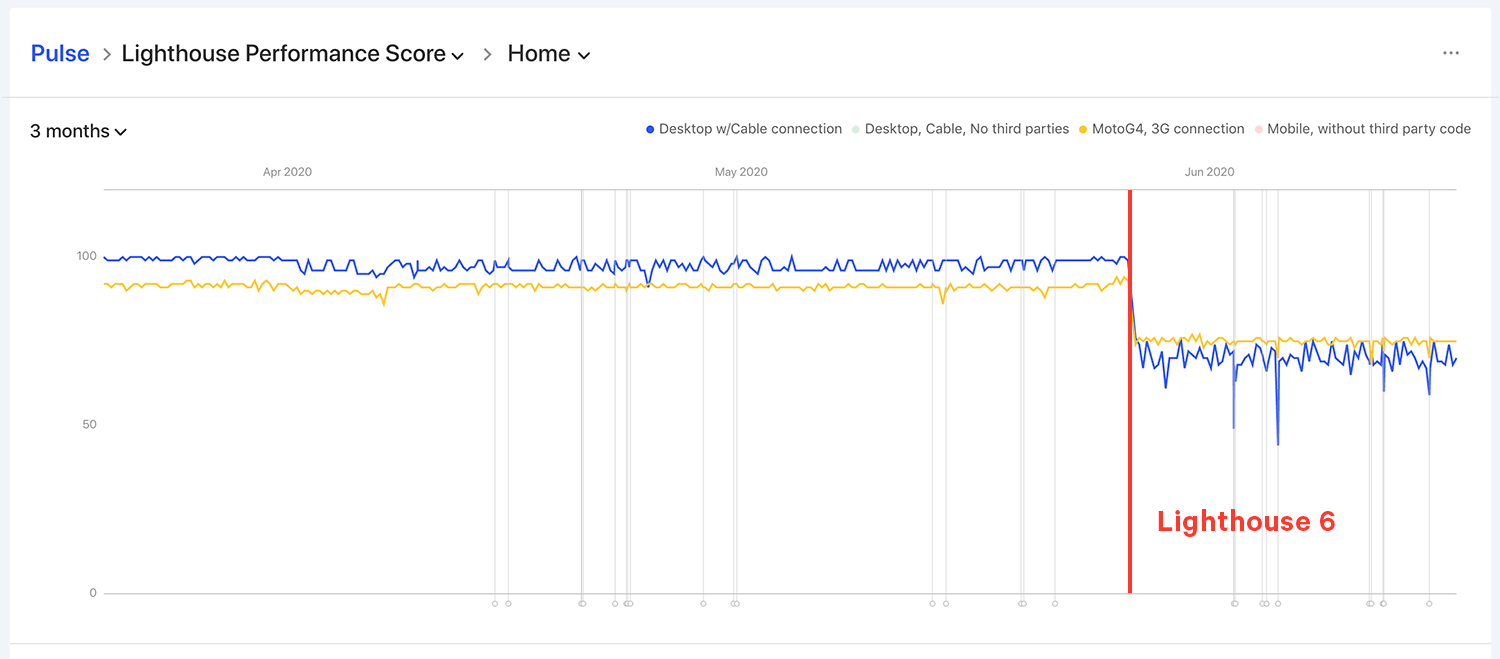
Some Sites, especially ones relying on JavaScript, can observe significant Performance Score changes.
With Lighthouse 6, we are also reporting a new metric—Cumulative Layout Shift. Alongside Total Blocking Time and Largest Contentful Paint (present in Calibre since September and October 2019), CLS is a part of a new generation of performance metrics that aim to portray user experience more accurately.
This also means that you can track all Web Vitals (Total Blocking Time, Largest Contentful Paint and Cumulative Layout Shift) in Calibre. We are committed to keeping our platform on par with the newest developments in the performance space.
Using the Long Task Timeline is a great way to identify potential issues with JavaScript performance. We updated the visual representation and categorisation of tasks to make it more clear.
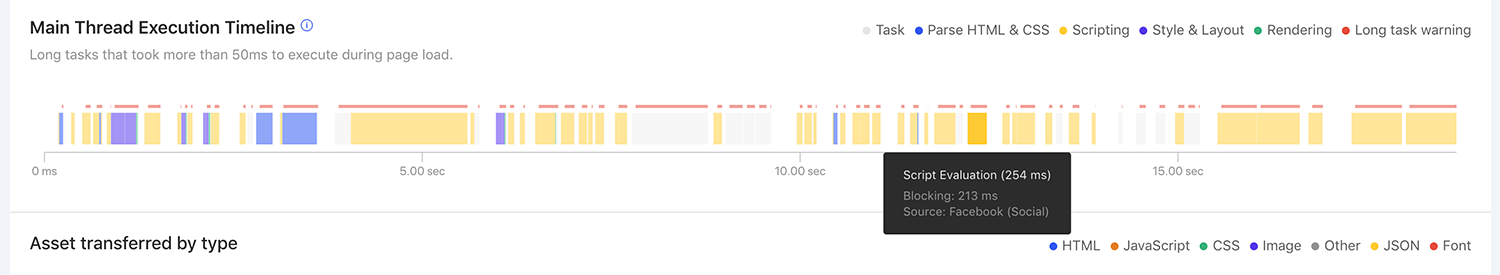
See all the long task warnings and blocking scripts.
The Long Task Timeline showcases all long task warnings and blocking times in the lifespan of the main thread activity. This means that you can not only inspect tasks that contribute to Total Blocking Time (defined between First Contentful Paint and Time to Interactive boundaries) but other long tasks on the main thread that don’t fall in this category.
React Live Chat Loader, our open source component that mitigates the negative performance impact of live chat tools now supports Drift.
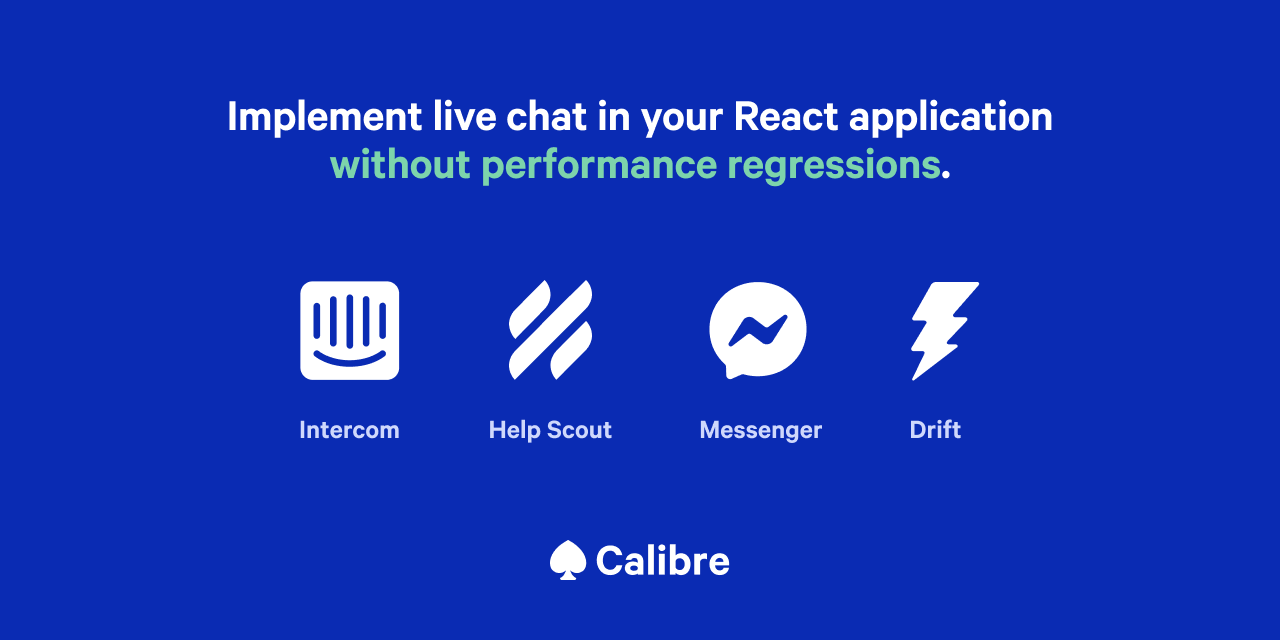
If you’re using Drift as your support or sales platform, and React powers your site or app, install React Live Chat Loader to improve your performance scoring.
Previously, when your trial has lapsed, or you have run out of your monthly test allocation, Pull Request Reviews would stop running. Now, Calibre will issue a comment informing you of the necessary steps to be taken to resume testing on your Pull Requests.
This will be especially helpful in contexts where developers rely solely on the GitHub integration versus also logging in to Calibre, where this messaging was always present.
You can now see how many tests were generated with Pull Request Reviews. If you are an administrator, head to Billing → Overview and click the Show per Site usage link.
The test usage will be split between Snapshots and Pull Request Reviews.
A minor version of the CLI has been released with the addition of milliunit measurement support. This will be necessary to report the Cumulative Layout Shift metric once Lighthouse 6 is available.
React Live Chat Loader, our open source component that mitigates the negative performance impact of live chat tools, now supports Facebook Messenger.
If you are using Intercom, Help Scout or Facebook Messenger in your React-powered site or application, you will be able to use the component out of the box and improve your performance metrics. To see its benefits, read about how we improved the speed of our live chat by 30%.
When creating or editing a Test Profile, we now highlight when a Third Party was detected last. That means it’s easier to discover if a Third Party should still be included or not in your blocklists.
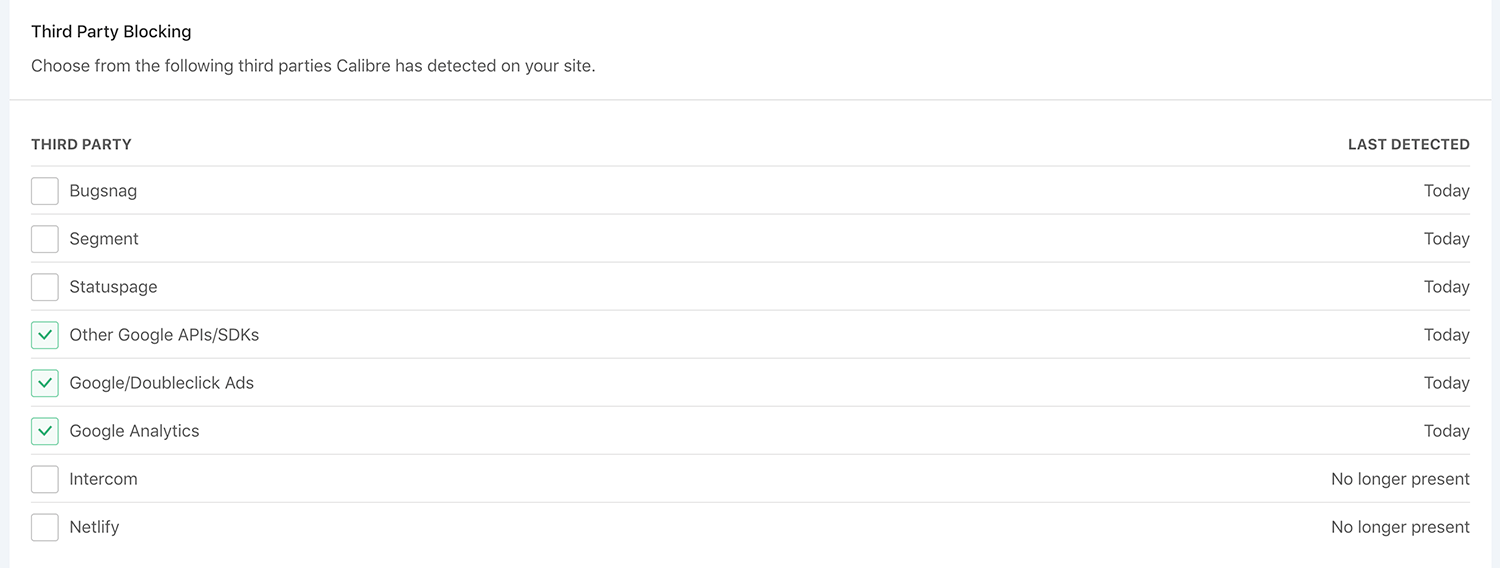
When editing or adding a Test Profile, you can see when a Third Party was detected last.
We have revamped the Billing area to make it easy to see your test allocation usage, manage Plans, tax information and receipts.
In Billing → Overview you can now see per Site test usage as well as delete your organisation.
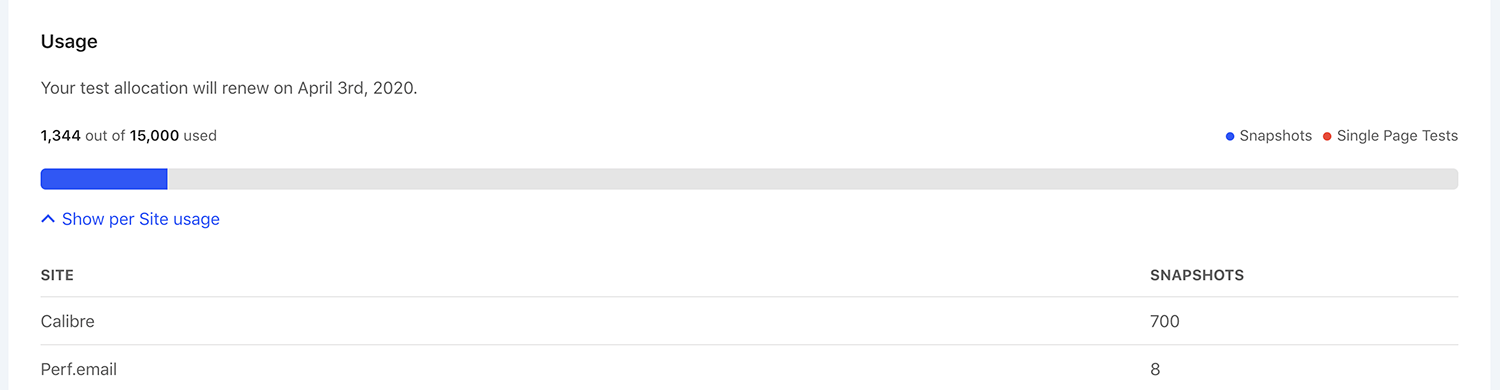
Billing Overview shows test allocation usage for each Site
You can add or update your default credit card under Billing → Payment method. In Billing → Receipt History and Settings you can ensure your receipts include all necessary information for your tax department and accountants.
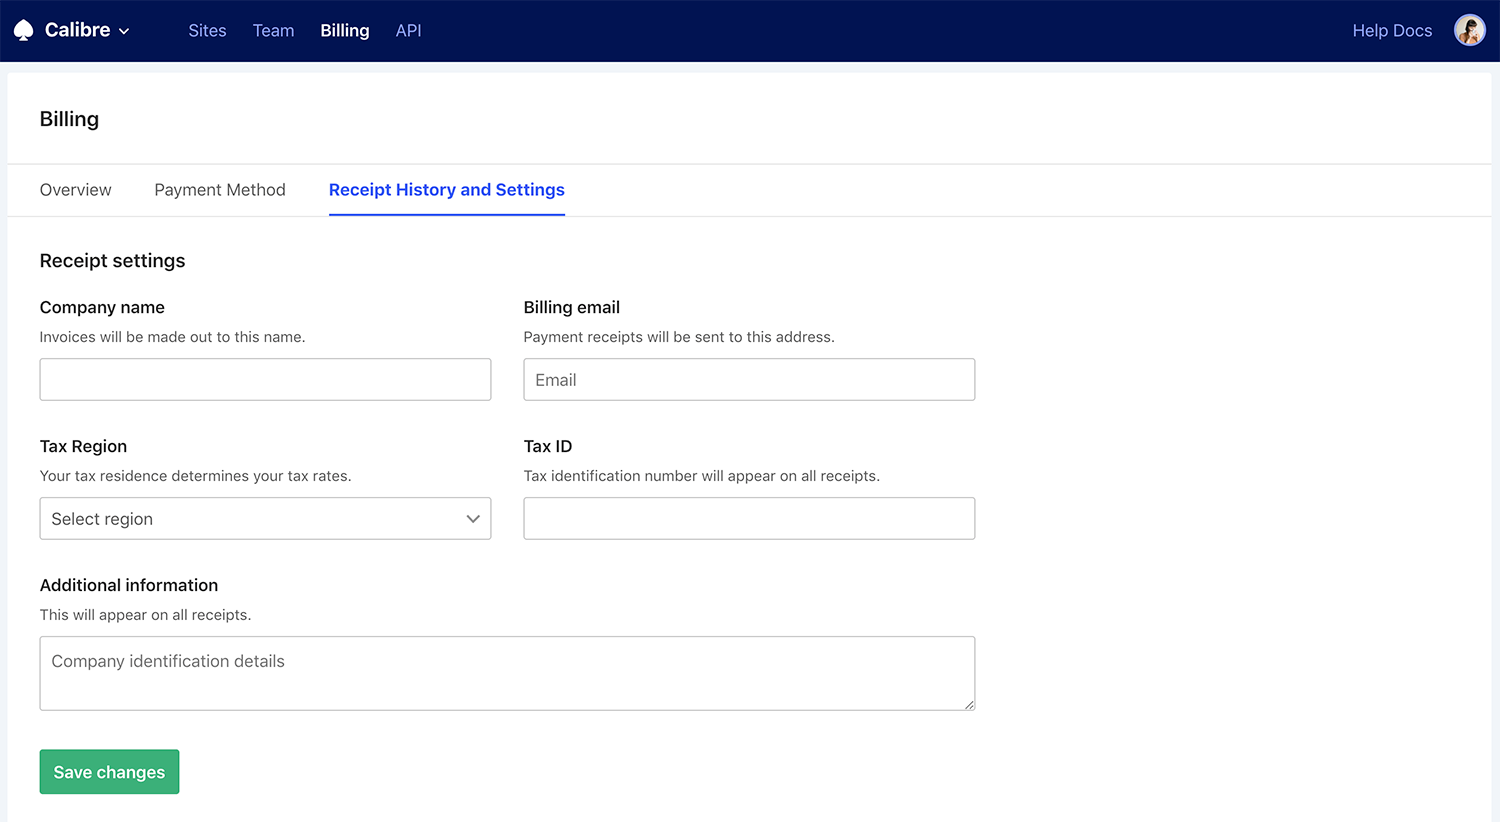
Receipt History and Settings allows for customising your receipts accordingly to your tax needs.
At any point, you can adjust your Plan accordingly to your usage.
When using Calibre, you are always in control of your monitoring data. We encourage exporting and building custom integrations with the help of our Node.js API and command-line client.
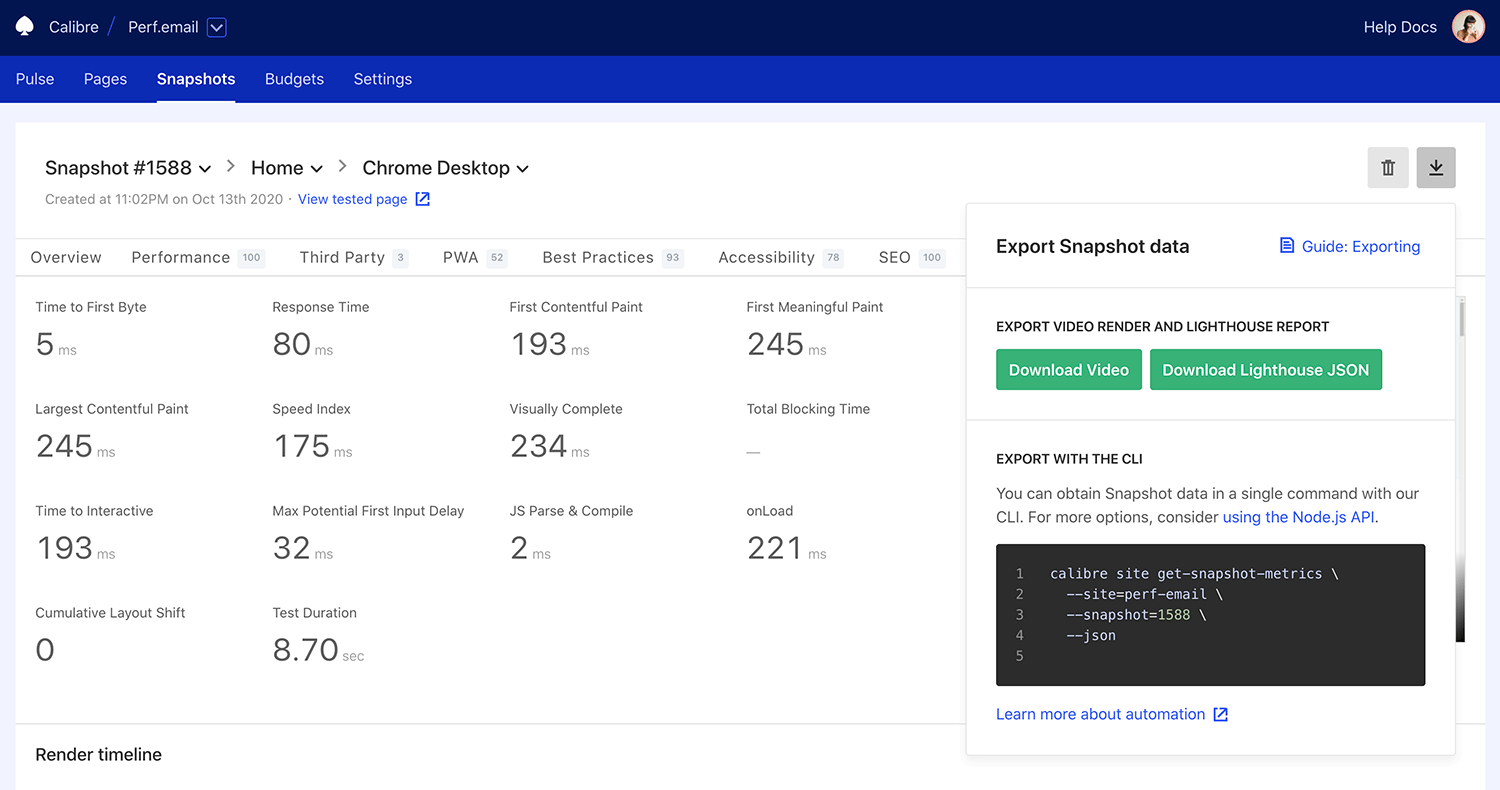
Exporting directly from the Calibre interface is now even more accessible. You can quickly export metric or Snapshot data from Pulse, Metric and Snapshot views. You can download a CSV, Lighthouse JSON or your page video render (depending on the context), or copy a pre-baked code snippet to use with the CLI.
We redesigned the email you receive after adding a new tracked Site to Calibre. Now, you can see three key metrics—Performance Score, Time to Interactive and Largest Contentful Paint and how they compare to the Calibre test dataset. This change should bring more context into where your Sites are at from the very first minutes of testing.
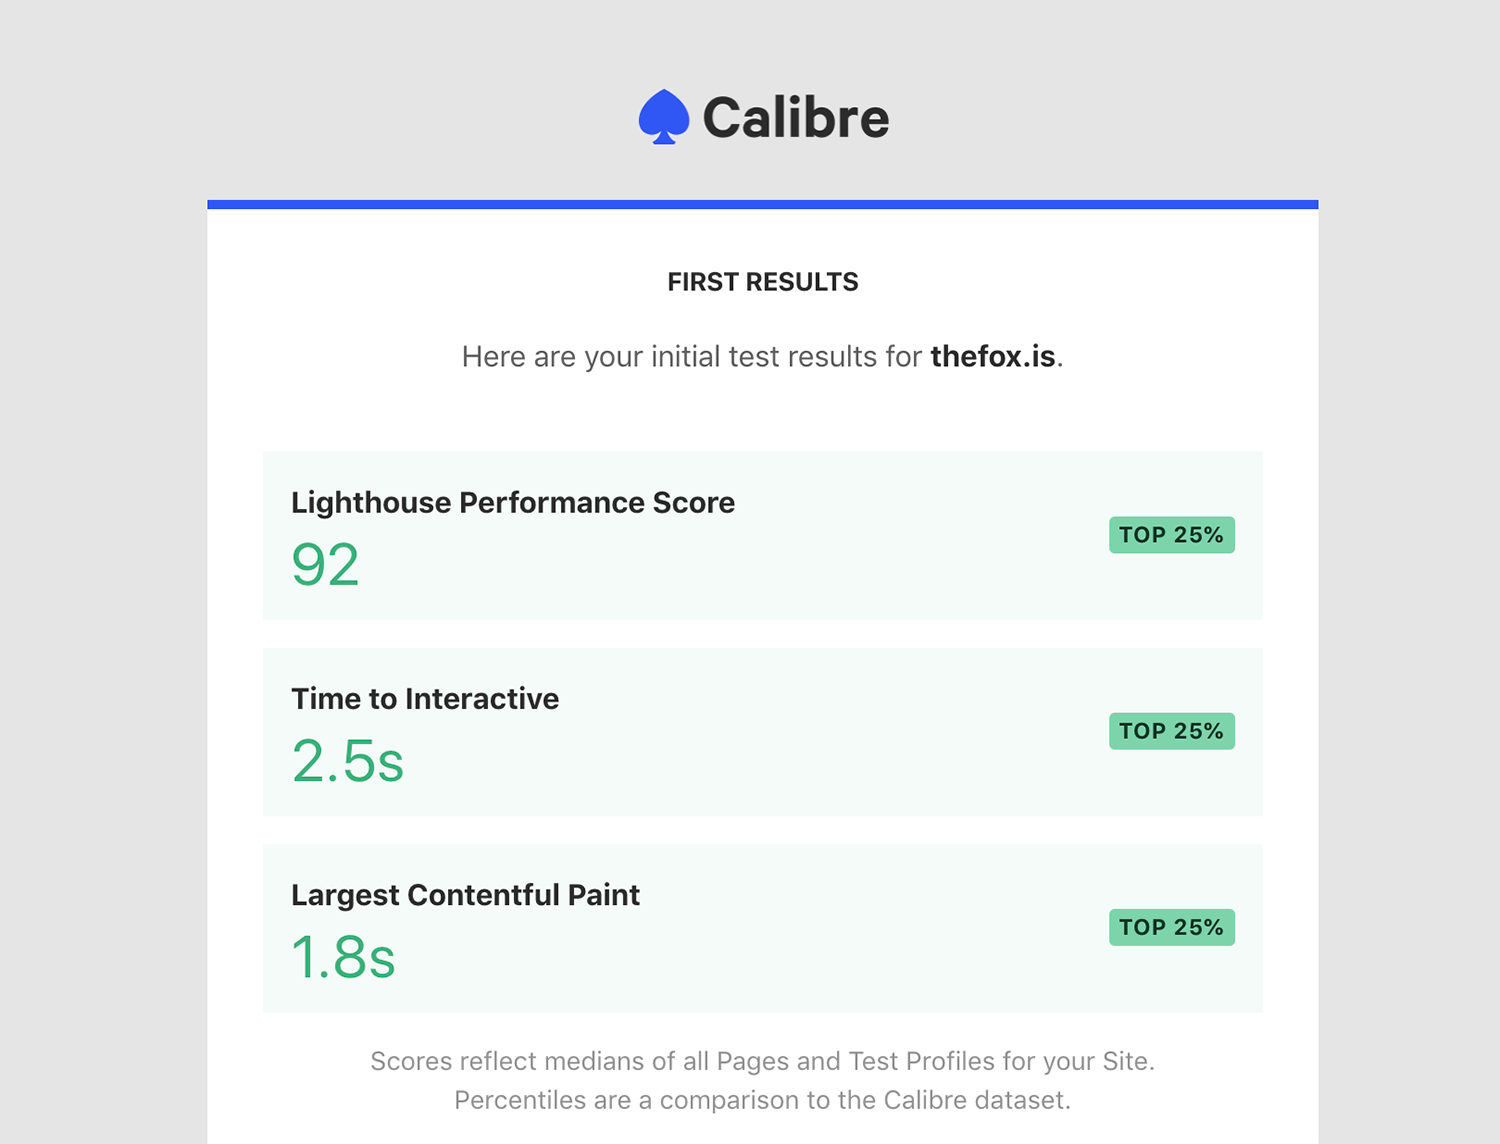
Initial Test email showcasing key metrics and benchmarks for the Site.
Additionally, all of our other emails also got a splash of new paint to match.
The CLI has seen two patch releases with the following changes:
to and from arguments in CLI get-pulse-metrics commandIf you want to be up-to-date with releases as they are published, follow the changelog.
We launched Test Packs to allow increasing testing capacity without upgrading your Plan. Each Test Pack adds 5,000 tests to your account and can be added or removed at any time, depending on your needs.
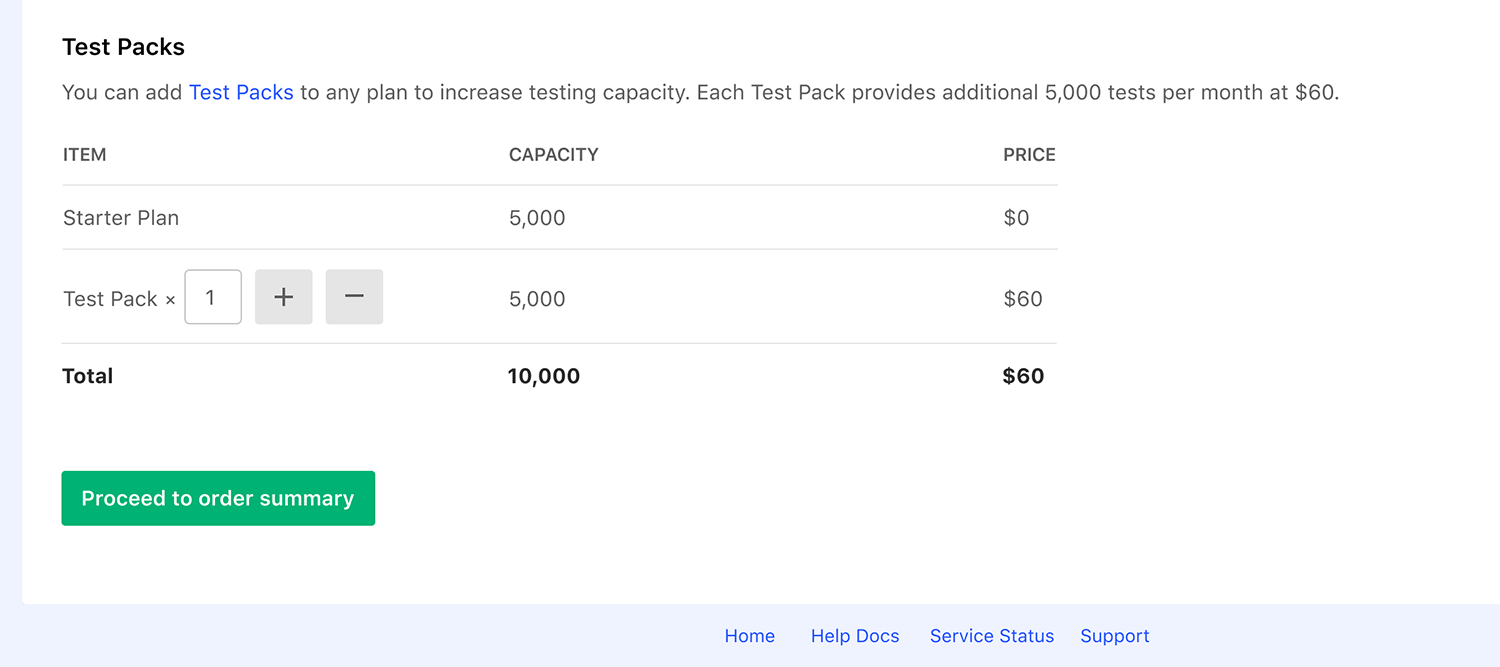
Add or remove Test Packs to control testing capacity without changing your Plan.
Learn how to use Test Packs or add one in Billing → Overview by clicking the Change plan and manage Test Packs button.
New major release of the CLI brings more functionality, customizability and better error handling. You can now:
--schedule and --interval optionsRead the full changelog or browse the API documentation.
Max Potential First Input Delay is calculated based on First Input Delay (FID). It portrays the maximum time it takes the browser to respond to a user action, such as clicking a button or trying to type something into a form. Max Potential FID can be used alongside Time to Interactive to quantify when your sites and apps can be successfully interacted with.
You can add Max Potential First Input Delay to the Pulse page through customising the Metric History view and set budgets against it.
Most performance and user experience issues are discovered when it’s already too late—long after they have already impacted your customers. Pull Request Reviews allows you to identify speed bottlenecks before they reach production, directly in your Pull Requests.
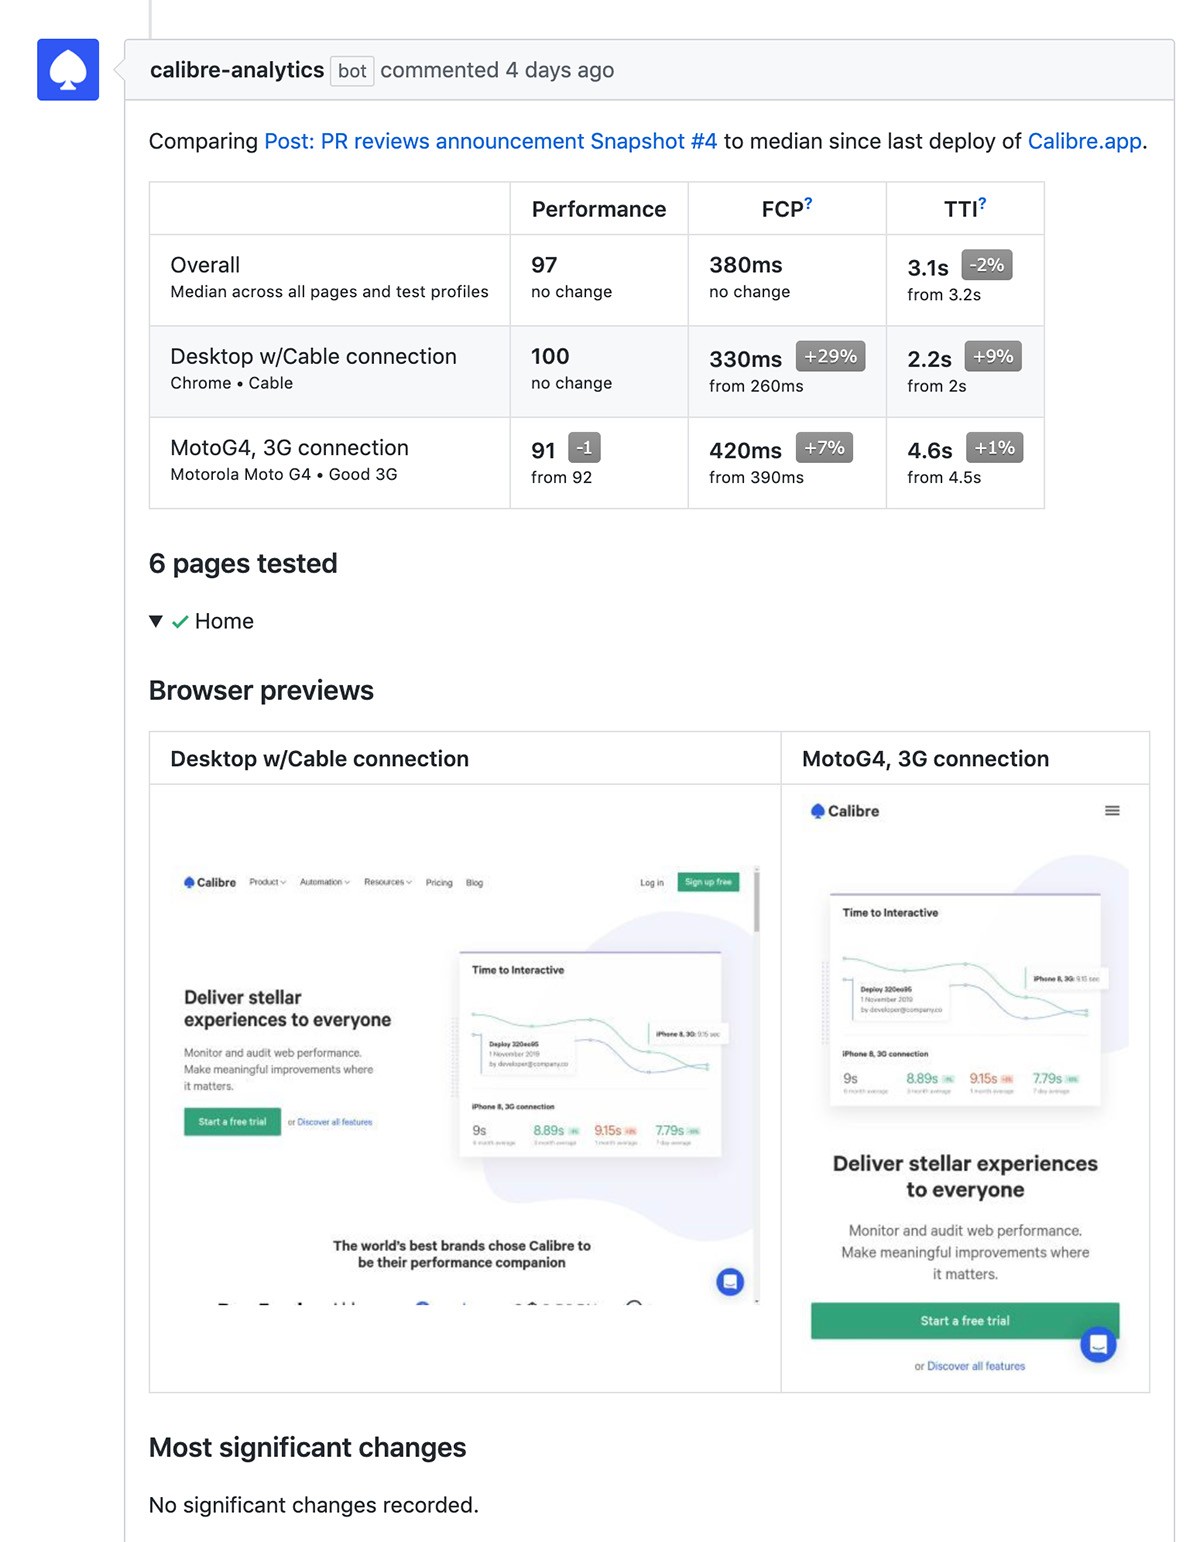
Pull Request Review performance report showcasing key metrics changes and pages tested.
If you’re using GitHub and one of the following deployment methods: Vercel, Heroku, Netlify or GitHub deployment statuses, you will be able to enable Pull Request Reviews and receive detailed performance reports on your work-in-progress. Read the announcement or learn how to get started.
When Lighthouse reports potential savings, you can now inspect their details to find out where exactly to look and how much time or bandwidth is there to be saved.
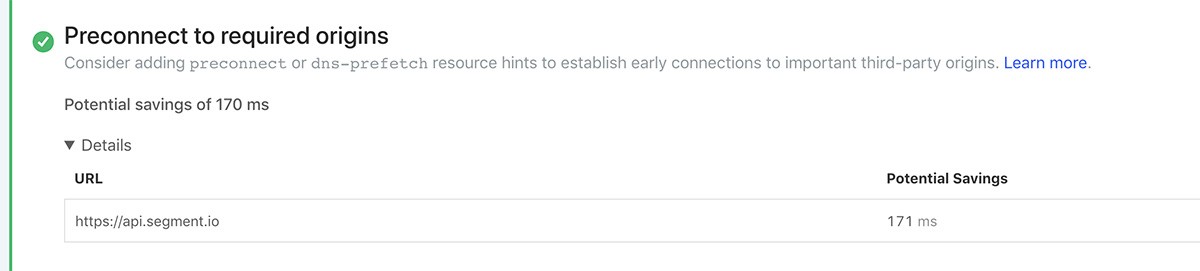
Example estimated savings for a request in the Performance Report.