

Time is perceived subjectively by all of us; therefore, optimizing for what directly affects this perception should be an essential part of every performance strategy—always prioritize the user experience.
In this post, we will introduce you to Time to Interactive—a performance metric focusing on what users see and experience.
The problem with web performance metrics#
How can metrics give us an understanding of what users experience? Historically, it was common to use Page Load Time as an indicator of performance, but it ultimately didn’t describe user experience but only signified that the page was fully loaded.
There is a trend of people recommending and using paint-based metrics as part of their web performance analysis. First Contentful Paint and Largest Contentful Paint are beneficial indicators because they describe vital moments of our content rendering.
Page load time and paint based metrics do not tell us enough.
The exciting new Long Tasks API gives us the ability to detect JavaScript tasks (function calls, event handlers, user input events) on the main thread that exceed 50ms in duration. The authors didn’t select this number randomly. Studies show that it takes only 100ms before users notice a delay following an interaction.
What is Time to Interactive?#
Time to Interactive is a performance metric highlighting the moment when the JavaScript main thread is idle for several seconds. The motivation behind it is to measure how efficient a site or application is when interacted with. As it relies on the main thread, it is heavily dependent on both the amount of JavaScript and the CPU speed of a given device.
You’ve likely once tapped on a link at the moment when the browser decided to render more content. Suddenly, you were relocated to a different section of the page or another website without additional input from your side. Frustrating, right? The reason behind this behaviour is a non-interactive moment when the browser’s main thread is blocked.
To better understand Time to Interactive, we must explain what the main thread does and why Javascript can block it.
How does the JavaScript main thread work?#
Despite your powerful computer or brand new phone with multiple CPU cores, JavaScript still operates in a single-threaded environment.
We can visualise the main thread as a pipeline that handles JavaScript execution, matching the required CSS rules and calculating each element’s layout. Finally, it’s responsible for drawing and composing the page.
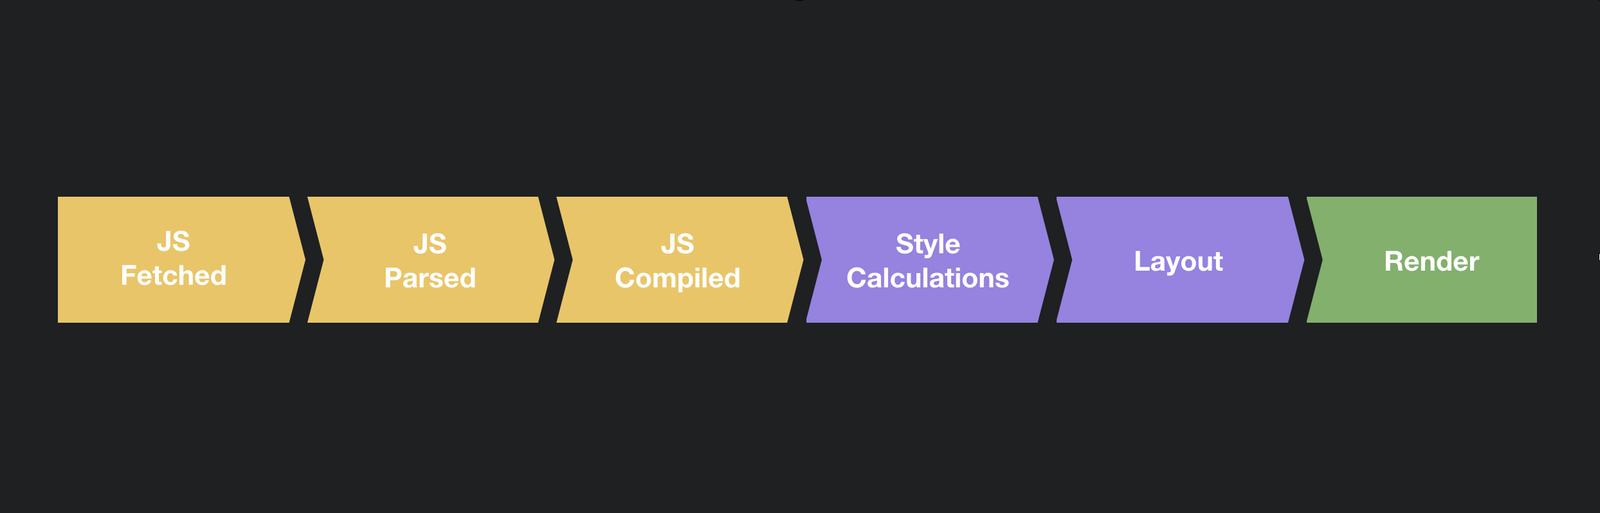
As the browser manages all user interface interactions and updates in this single-threaded environment, the main thread becomes blocked when a single long-running operation prevents the completion of the following process in the pipeline.
Blocking the main thread#
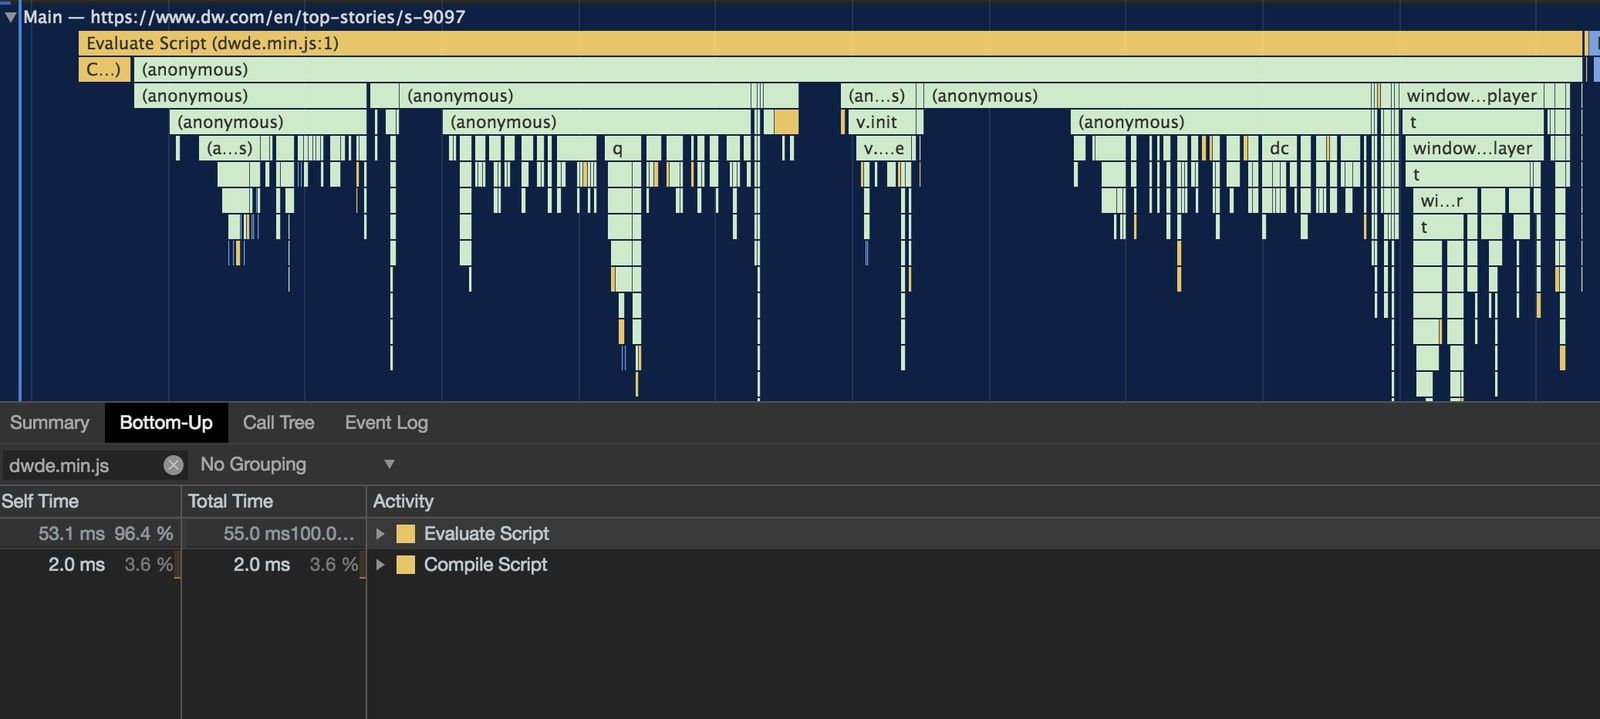
Building complex web applications with a lot of JavaScript code can sometimes cost us more than initially meets the eye. Addy Osmani explained in great detail within his article "The Cost of JavaScript". After downloading the JavaScript code, he noted that one of the highest costs for the JS engine is to parse and compile it.
Parsing and compilation processes add new tasks to the JavaScript event loop part of the main thread. Any tasks that exceed 50ms are considered long tasks. During this time, users won’t be able to receive immediate feedback on their actions, resulting in the frustrating situation explained earlier.
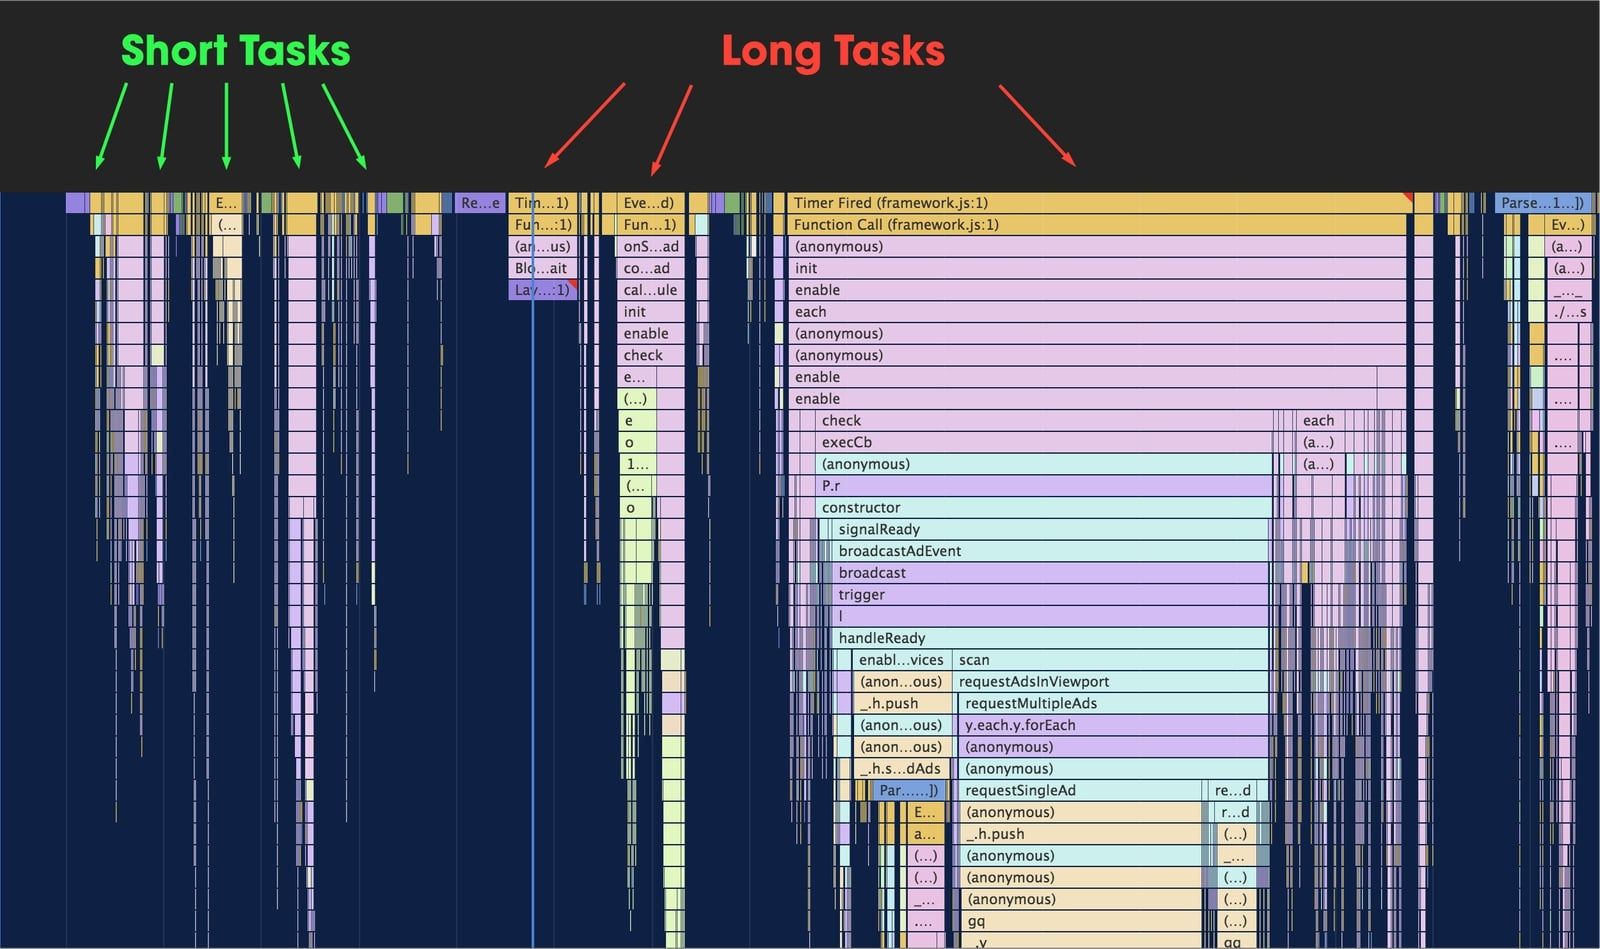
Blocking the main thread is far more destructive on mobile devices. Tasks that take 50ms on a high-powered desktop can take 3-5X longer on a phone. That results in lockups, poor animation, janky scrolling and battery drain.
These two aspects show how necessary it is to avoid long JavaScript tasks in the main thread. We can identify these problems in our web apps by continuously tracking Time to Interactive.
How is Time to Interactive calculated?#
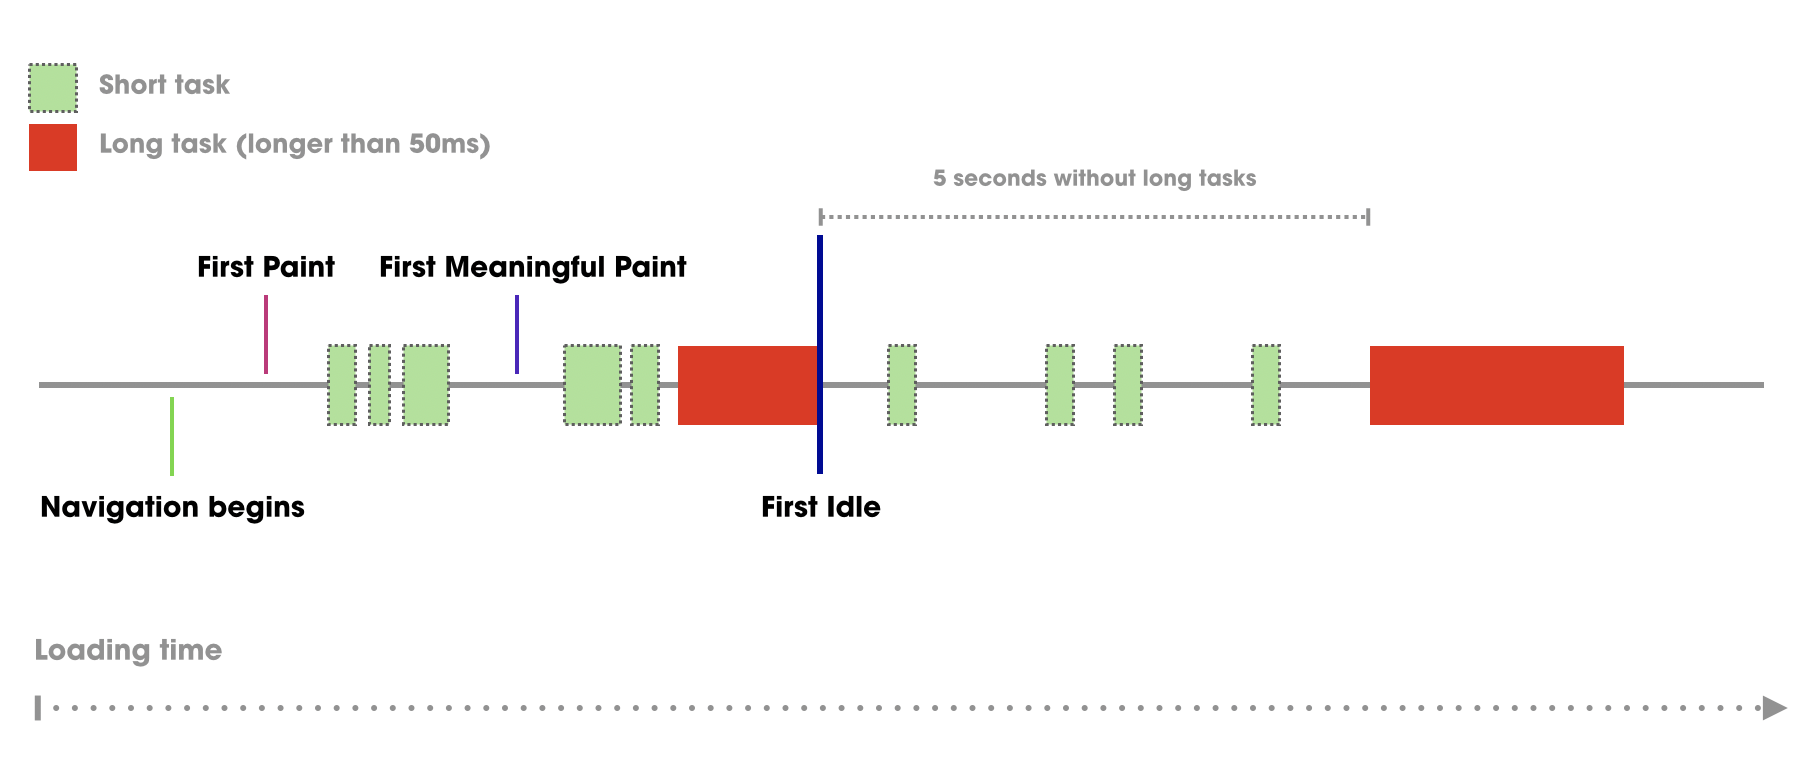
First Interactive and Consistently Interactive, later known as First Idle and Time to Interactive, are defined and calculated as follows:
- First Idle: the first early sign of time where the main thread has come to rest, and the browser has completed a First Meaningful Paint.
- Time to Interactive: after First Meaningful Paint. The browser’s main thread has been at rest for at least 5 seconds, and there are no long tasks that will prevent immediate response to user input.
These metrics help us to accurately calculate when an application is ready for interaction and will likely respond on time.
Why does Time to Interactive matter?#
Optimizing your web app or site with Time to Interactive means a better user experience since you’ll mitigate the risk of blocked interface elements.
In a recent case study about Pinterest’s Progressive Web App, the team observed 60% higher user engagement after reducing Time to Interactive from 23s to 5.6s and 3.9s on repeat visits.
Measuring Time to Interactive#
We can monitor Time to Interactive using Calibre’s automated web performance tests:
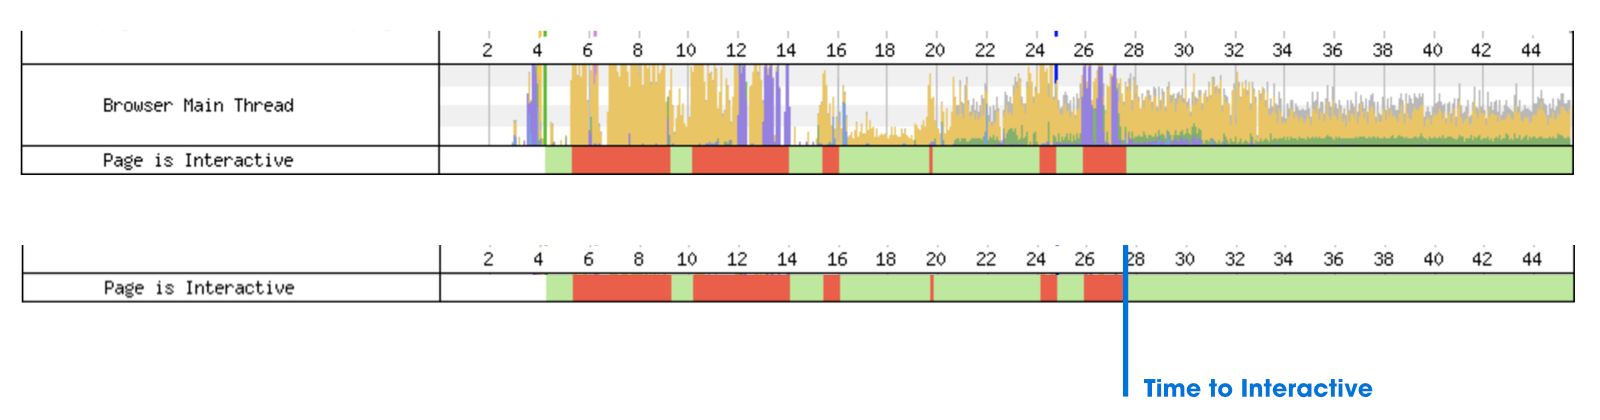
WebPageTest shows when the main thread is responsive as part of the waterfall diagram:
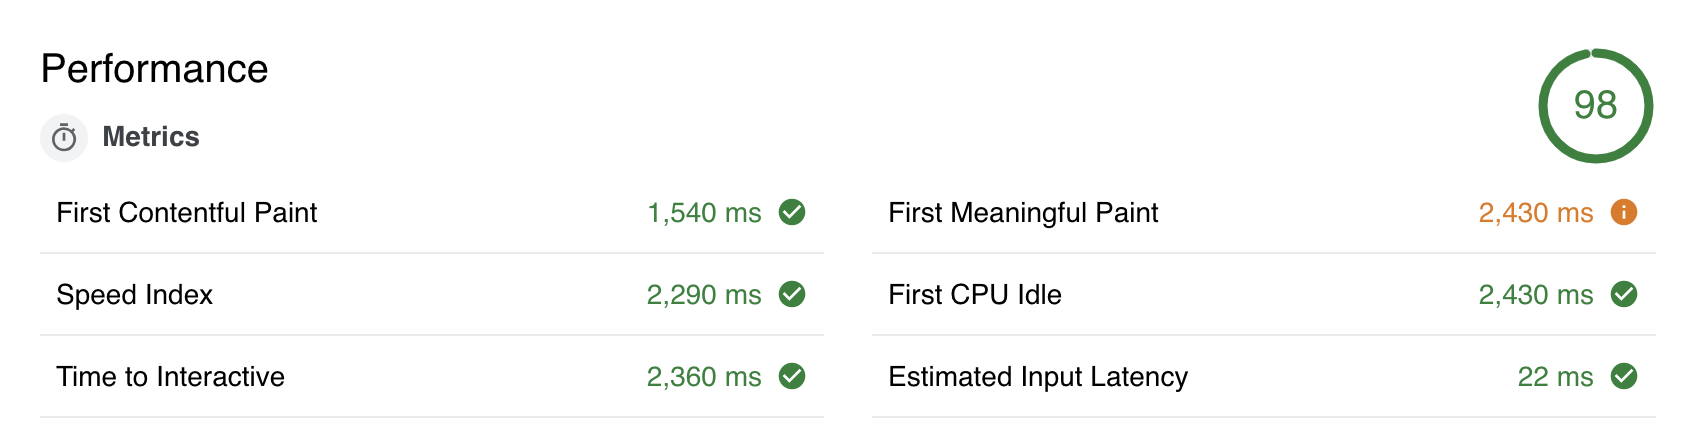
Lighthouse also has Time to Interactive built-in. You can run the performance audit report from your Chrome developer tools:
Time to Interactive gives valuable insight into people’s experiences using sites and applications. It helps us to understand the importance of creating accessible and responsive products.