When inspecting metric history charts on Pages Leaderboard and Budgets dashboard, you can now see corresponding deploys if you have enabled Deployment Tracking, are using the Netlify integration or Pull Request Reviews:
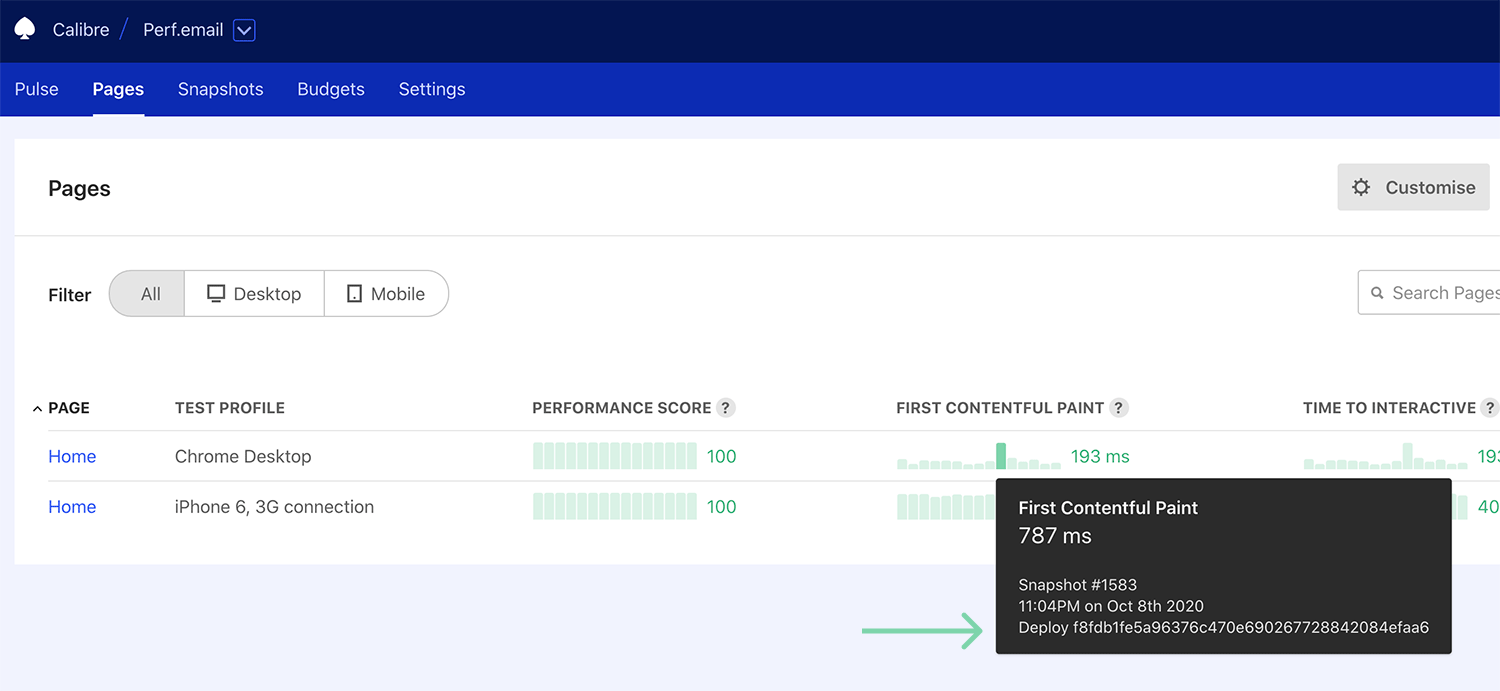
See corresponding deploys when exploring metric charts on Budgets and Pages Leaderboard.
This information should make it easier to identify potential spikes visualised in the bar charts. Click on an individual bar to inspect changes further in the Snapshot view.