Our Test Agents now use Lighthouse 9.1 We upgrade to stable Lighthouse releases as they become available and after they’re thoroughly tested so that you can leverage the newest version.
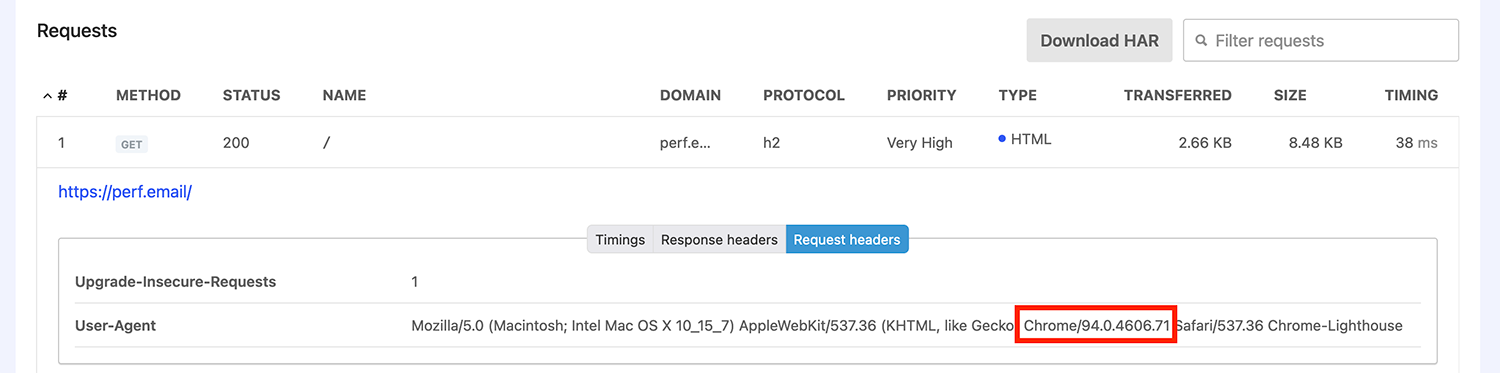
Chrome 94
Our Test Agents now use Chrome 94 to test your Sites. You can always check the Chrome version in the Lighthouse JSON export or by inspecting the Request Headers for the first request in each Snapshot:
Billing: See upcoming payments and receive batch receipts
Staying on top of subscription costs and reconciling payments is essential for any business. That’s why we’ve made improvements to make this process easier. Now, you can see the upcoming invoice amount on the Billing → Invoice History and Settings page:
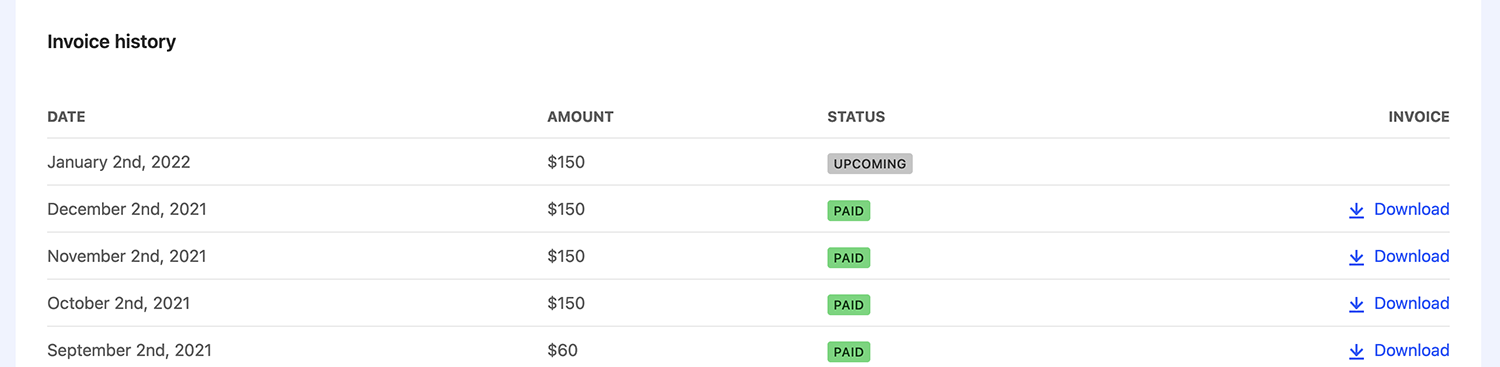
Making changes to Test Packs and User Seats could quickly generate multiple invoices. To avoid dealing with too many PDFs, we batch your changes as they happen and release an invoice after a short time delay. Nobody needs more accounting work!
Free tool: check your Core Web Vitals assessment
We created a free tool to check if your site passes the Core Web Vitals assessment. With Core Web Vitals Test, you can see how many site visitors have a good experience and if your site is likely to lose ranking in Google. All based on Google’s Chrome User Experience Report (CrUX) data:
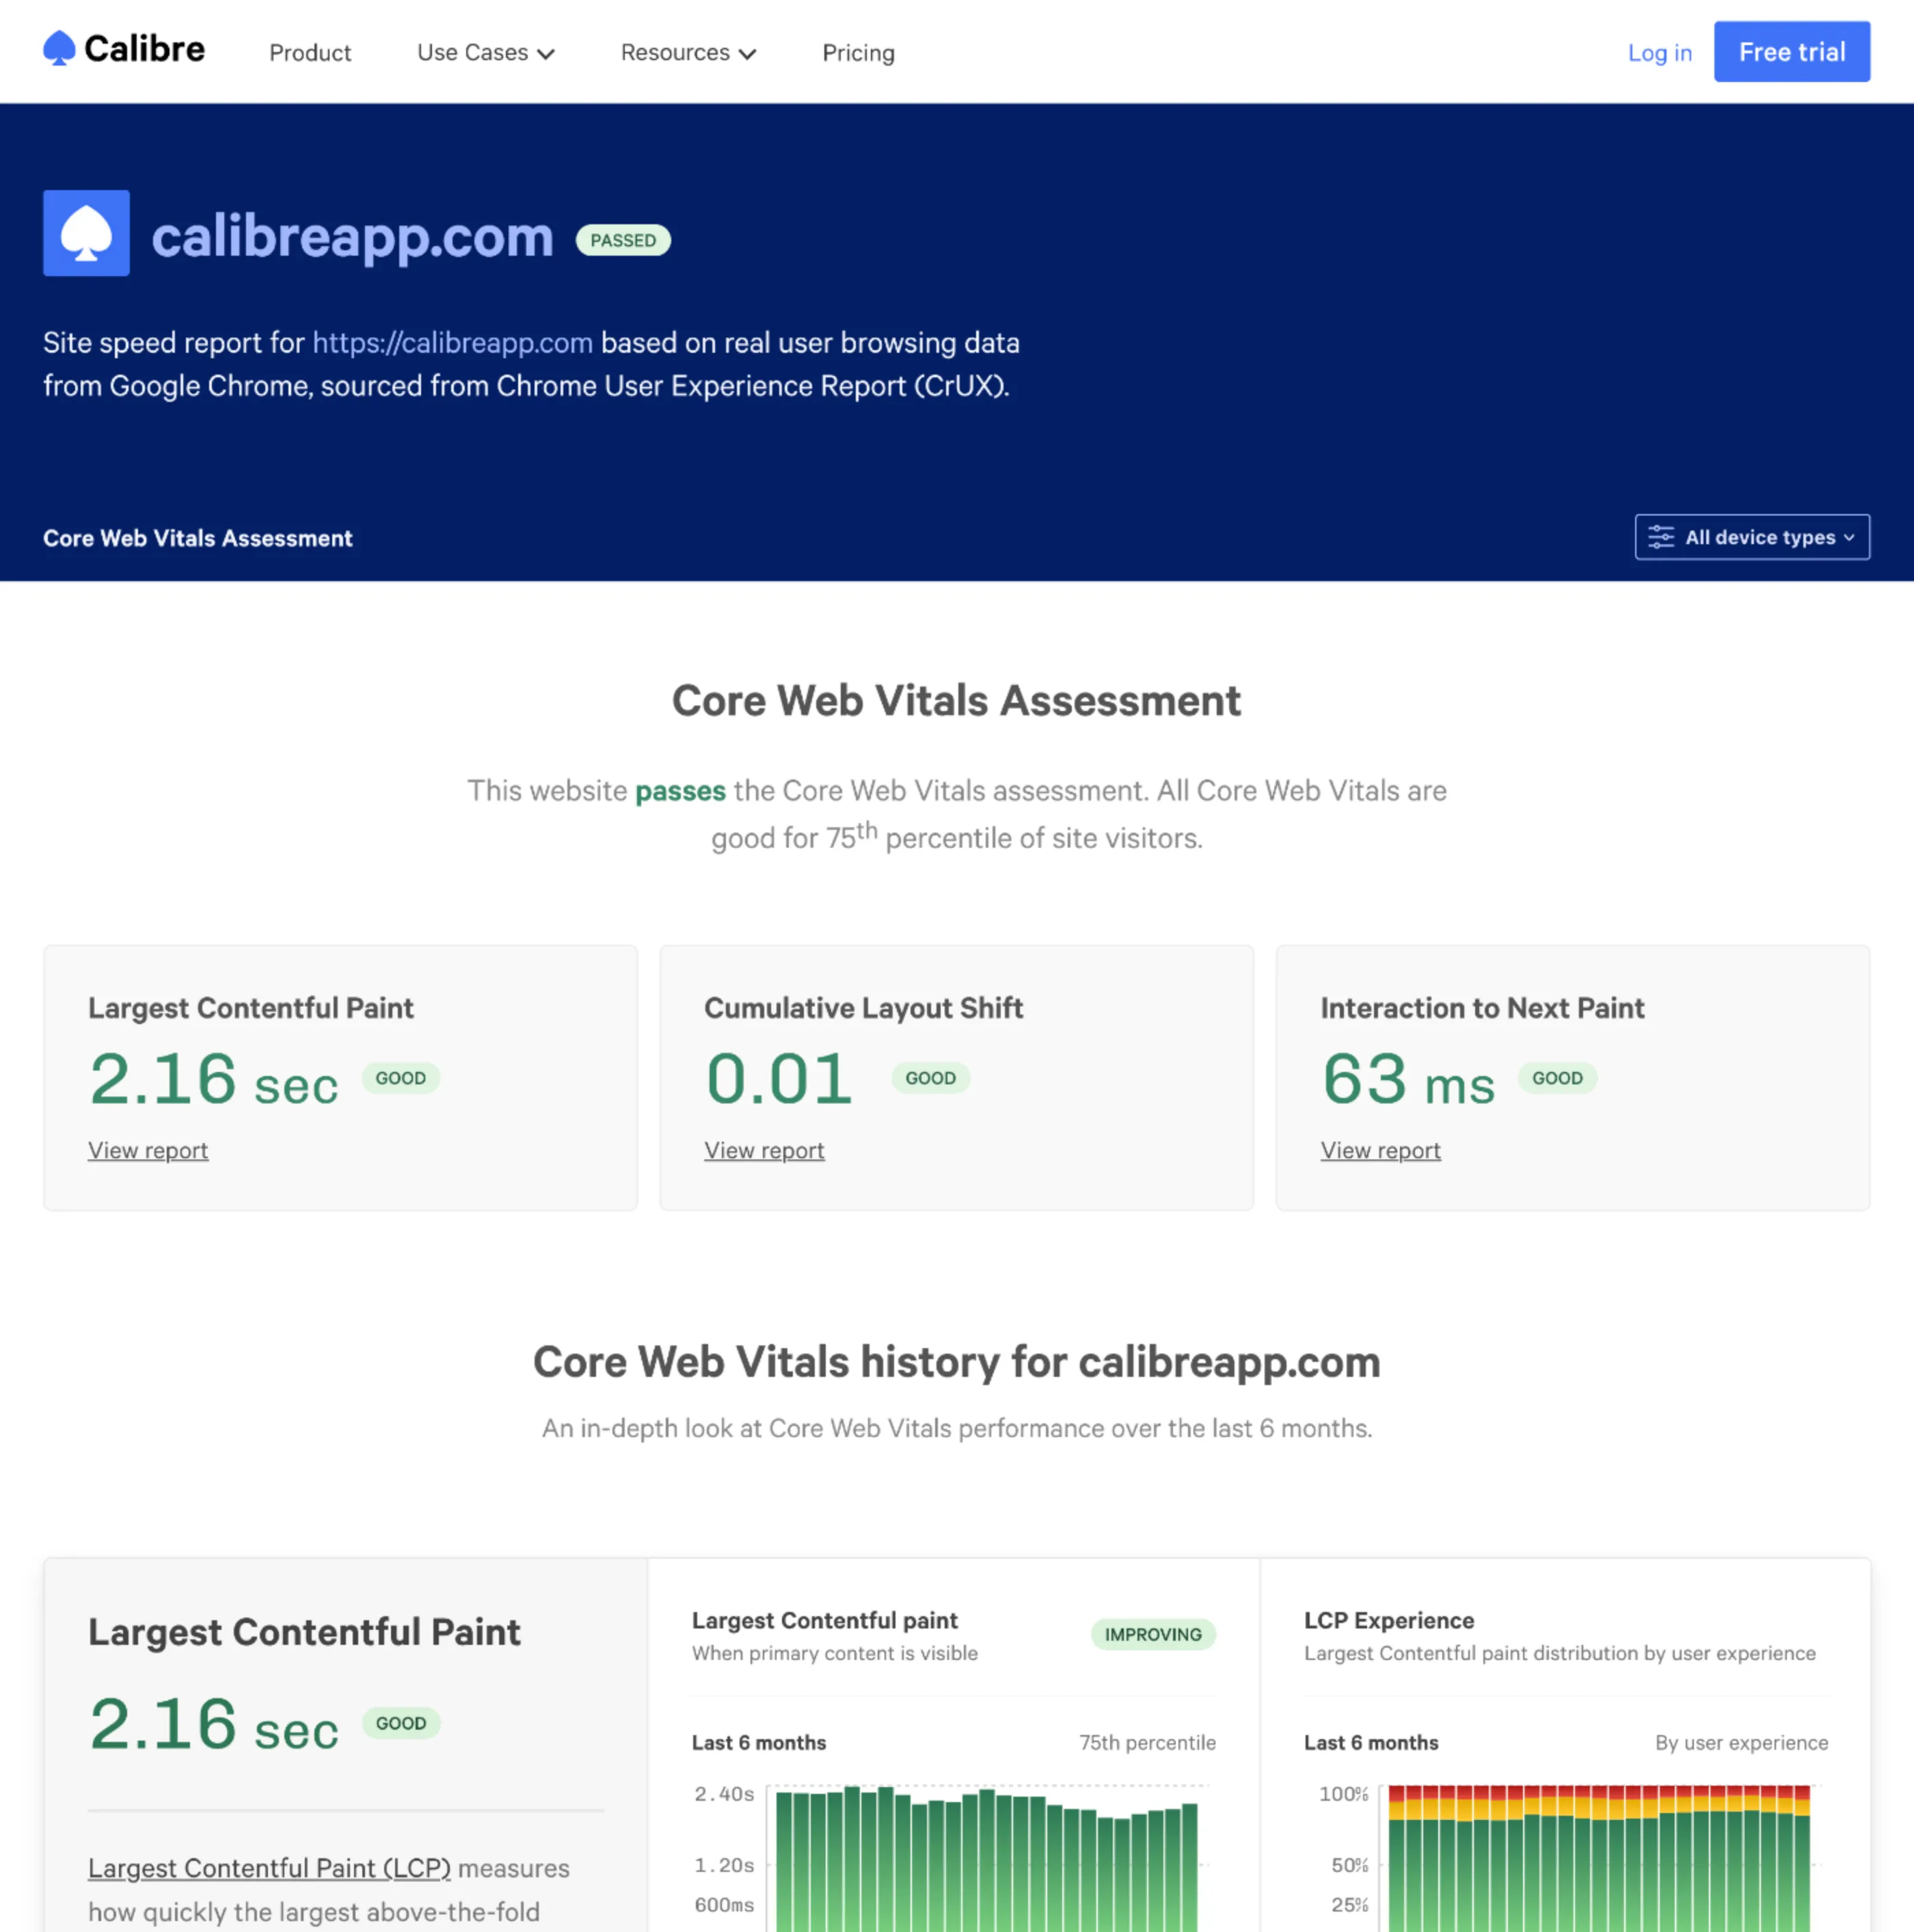
Core Web Vitals report for calibreapp.com domain.
Check your site, share your reports or learn more about the Core Web Vitals assessment.
Integrations: Build custom workflows with Zapier
Each team has different processes. Sending your monitoring data to your favourite services and creating automations can help with saving time and increasing transparency. We built a Zapier integration, so you can connect to over 4,000 supported apps and create custom workflows without any coding required!
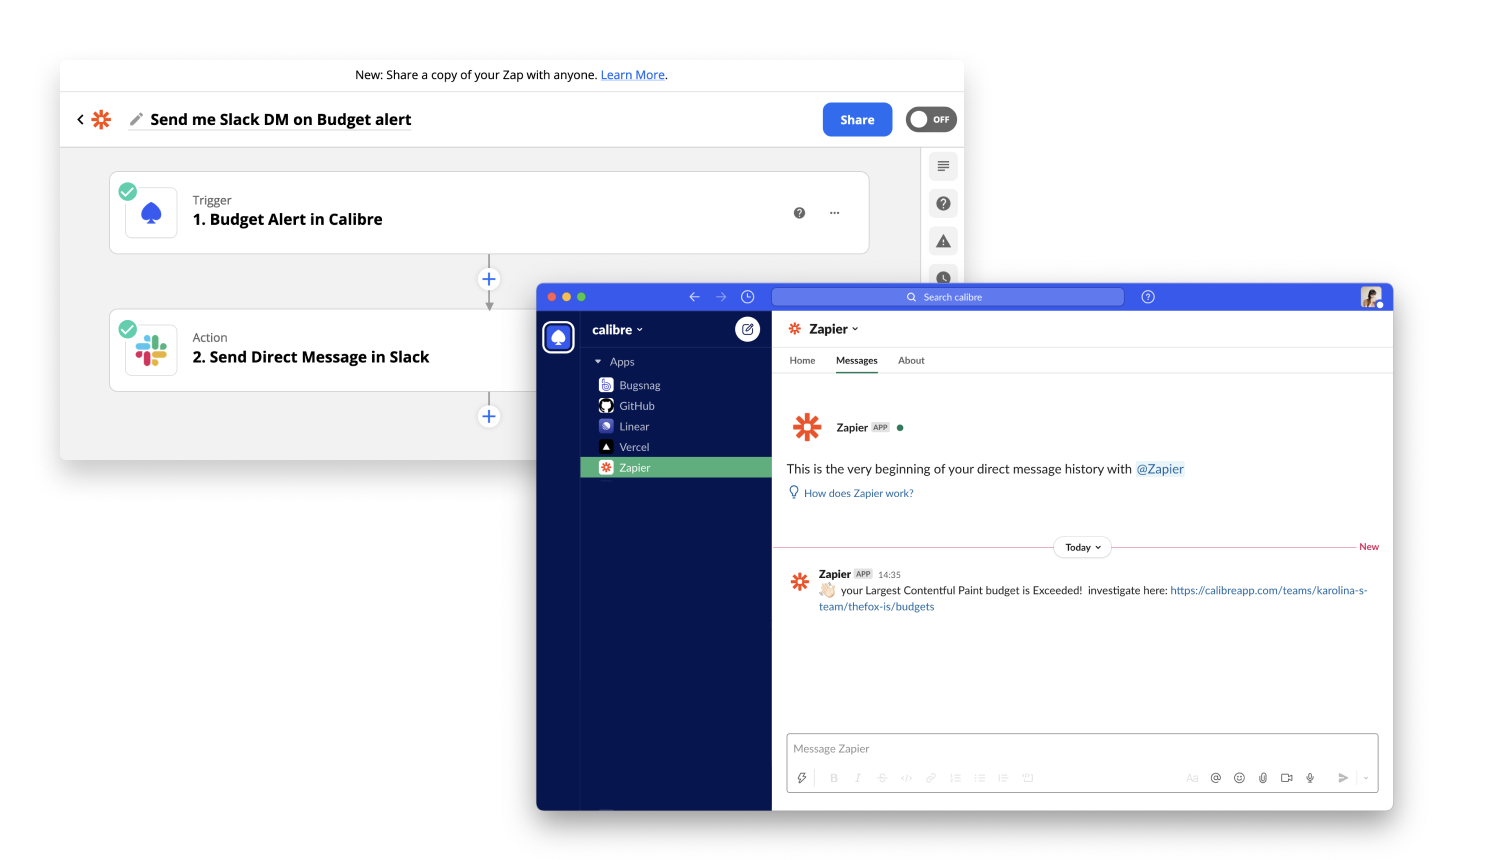
Example of a Zap that sends a custom Slack direct message when a Budget status changes.
We created a handful of boilerplate workflows (Zaps) to try:
- get a direct message in Slack when a performance budget alert fires
- send page speed data to Google Sheets or Airtable
- run a deploy on a new GitHub release
- create a Trello card to investigate exceeded performance budgets
Learn more about the Zapier integration or enable it on your Calibre account today.
Lighthouse 8.5
Our Test Agents now use Lighthouse 8.5. We upgrade to stable Lighthouse releases as they become available and after they’re thoroughly tested so that you can leverage the newest version.
CLI 4.0 and 4.0.1
We deprecated the site get-pulse-metrics command and replaced it with site metrics (a breaking change). We also added a metric-list command that lists all available metrics, their category, advised ranges and recommendations for tracking:
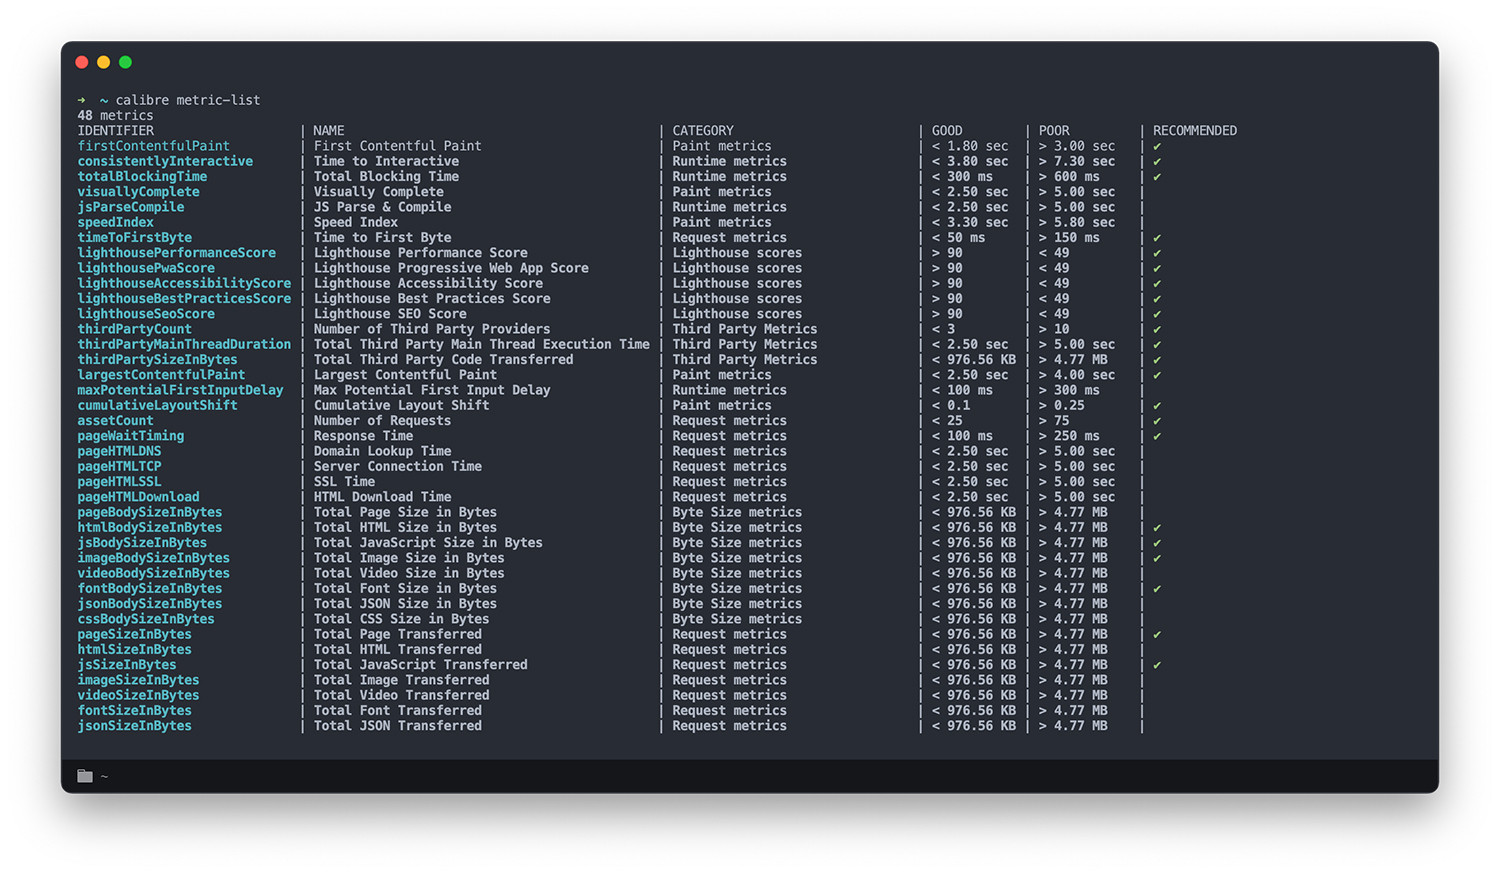
Read the full changelog here.
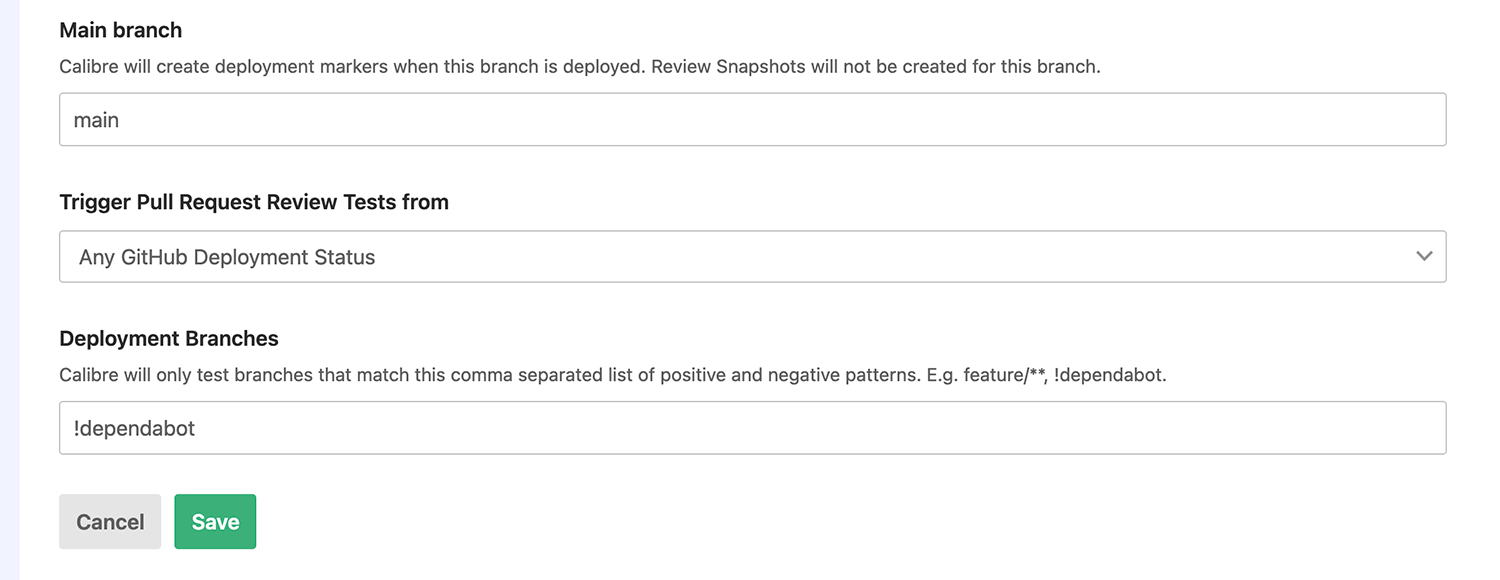
Pull Request Reviews: Add branch-specific configuration
If you’d like to (or already are) testing performance in GitHub Pull Requests, there is a new way to configure your test settings. With version 2, you can create configuration options for different branches using positive and negative patterns.
This is useful if you’d like to test differently based on branch names, for example, your preview-public branches are publicly accessible, but preview-* are password-protected:
version: 2
pullRequestReviews:
  - branches:
      - preview-*
    authentication:
      password: mysecretpassword
      formSelector: form
      passwordSelector: input[type=password]
      required: true
  - branches:
      - preview-public
    authentication:
      required: false
Or, you could report different metrics based on branch name too! Convert your configuration.yaml to the new, multi-block format to create branch-specific testing conditions.
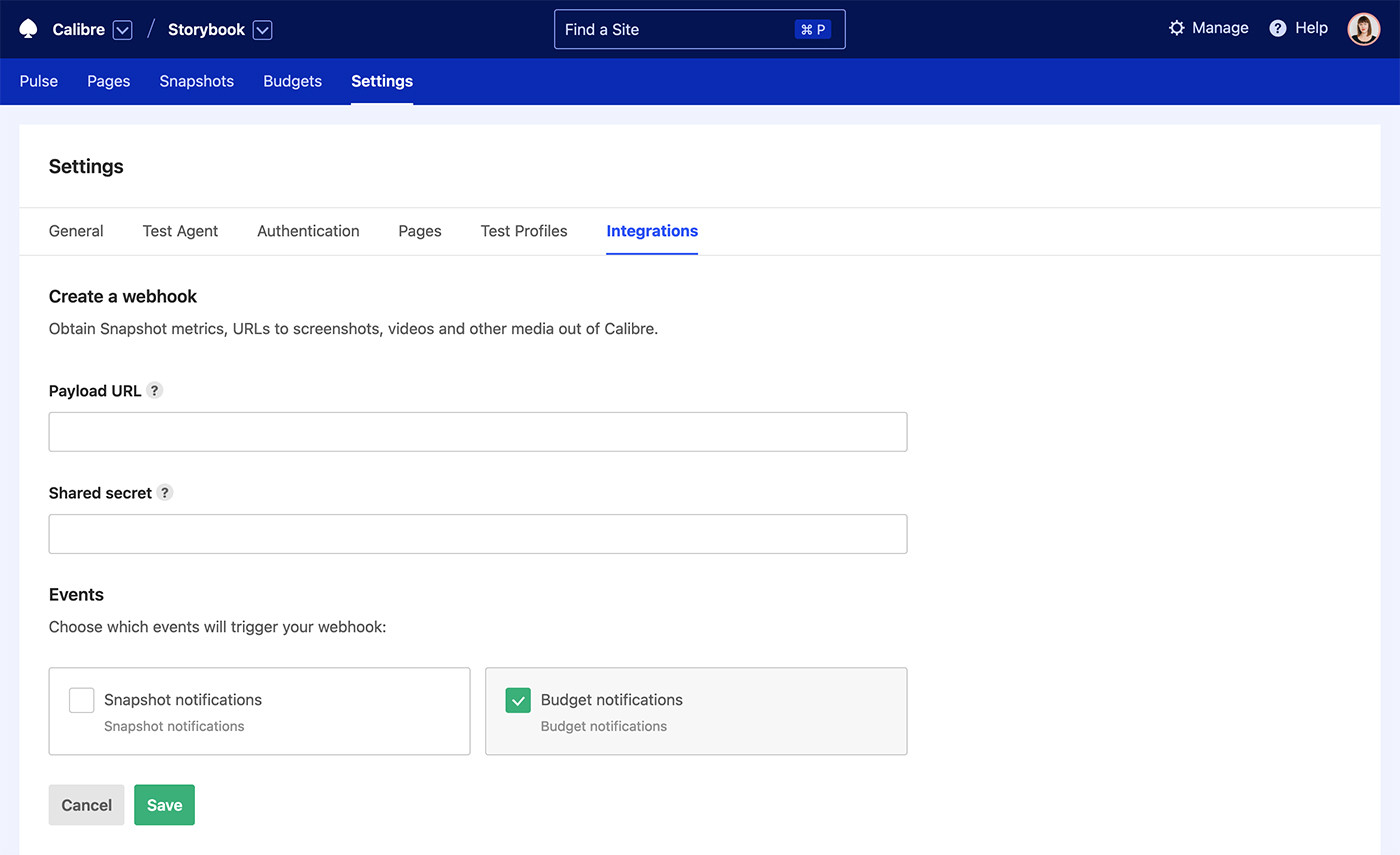
Performance Budgets: Receive webhook alerts
You can now use the webhook integration to get alerts about your Budgets. Go to Site Settings → Integrations → Add a Webhook to create one and receive a JSON payload on Budget status changes.
Integrations: Enable Deployment Tracking with Netlify
Previously, the only way to enable Deployment Tracking was to leverage the Node.js API, CLI or the HTTP Site API. You can now trigger Snapshots and add deployment markers to your charts with Netlify.
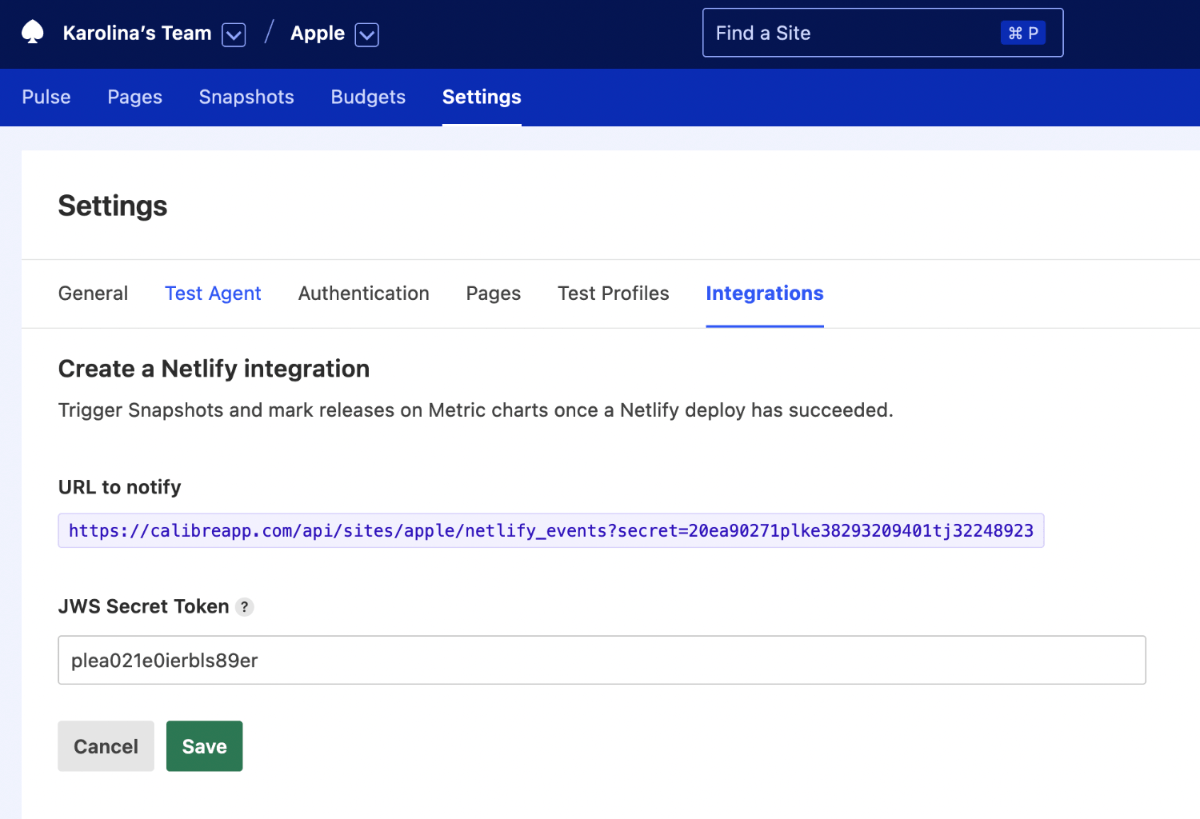
Generating credentials to enable a Netlify integration via a webhook.
You can enable the Netlify integration under Site → Synthetic → Settings → Integrations → Netlify → Add Webhook.
Integrations: Get alerts when integrations have issues
Using integrations can be a powerful way to connect the services you use. But it can be frustrating when an integration stops working, and we don’t know about it.
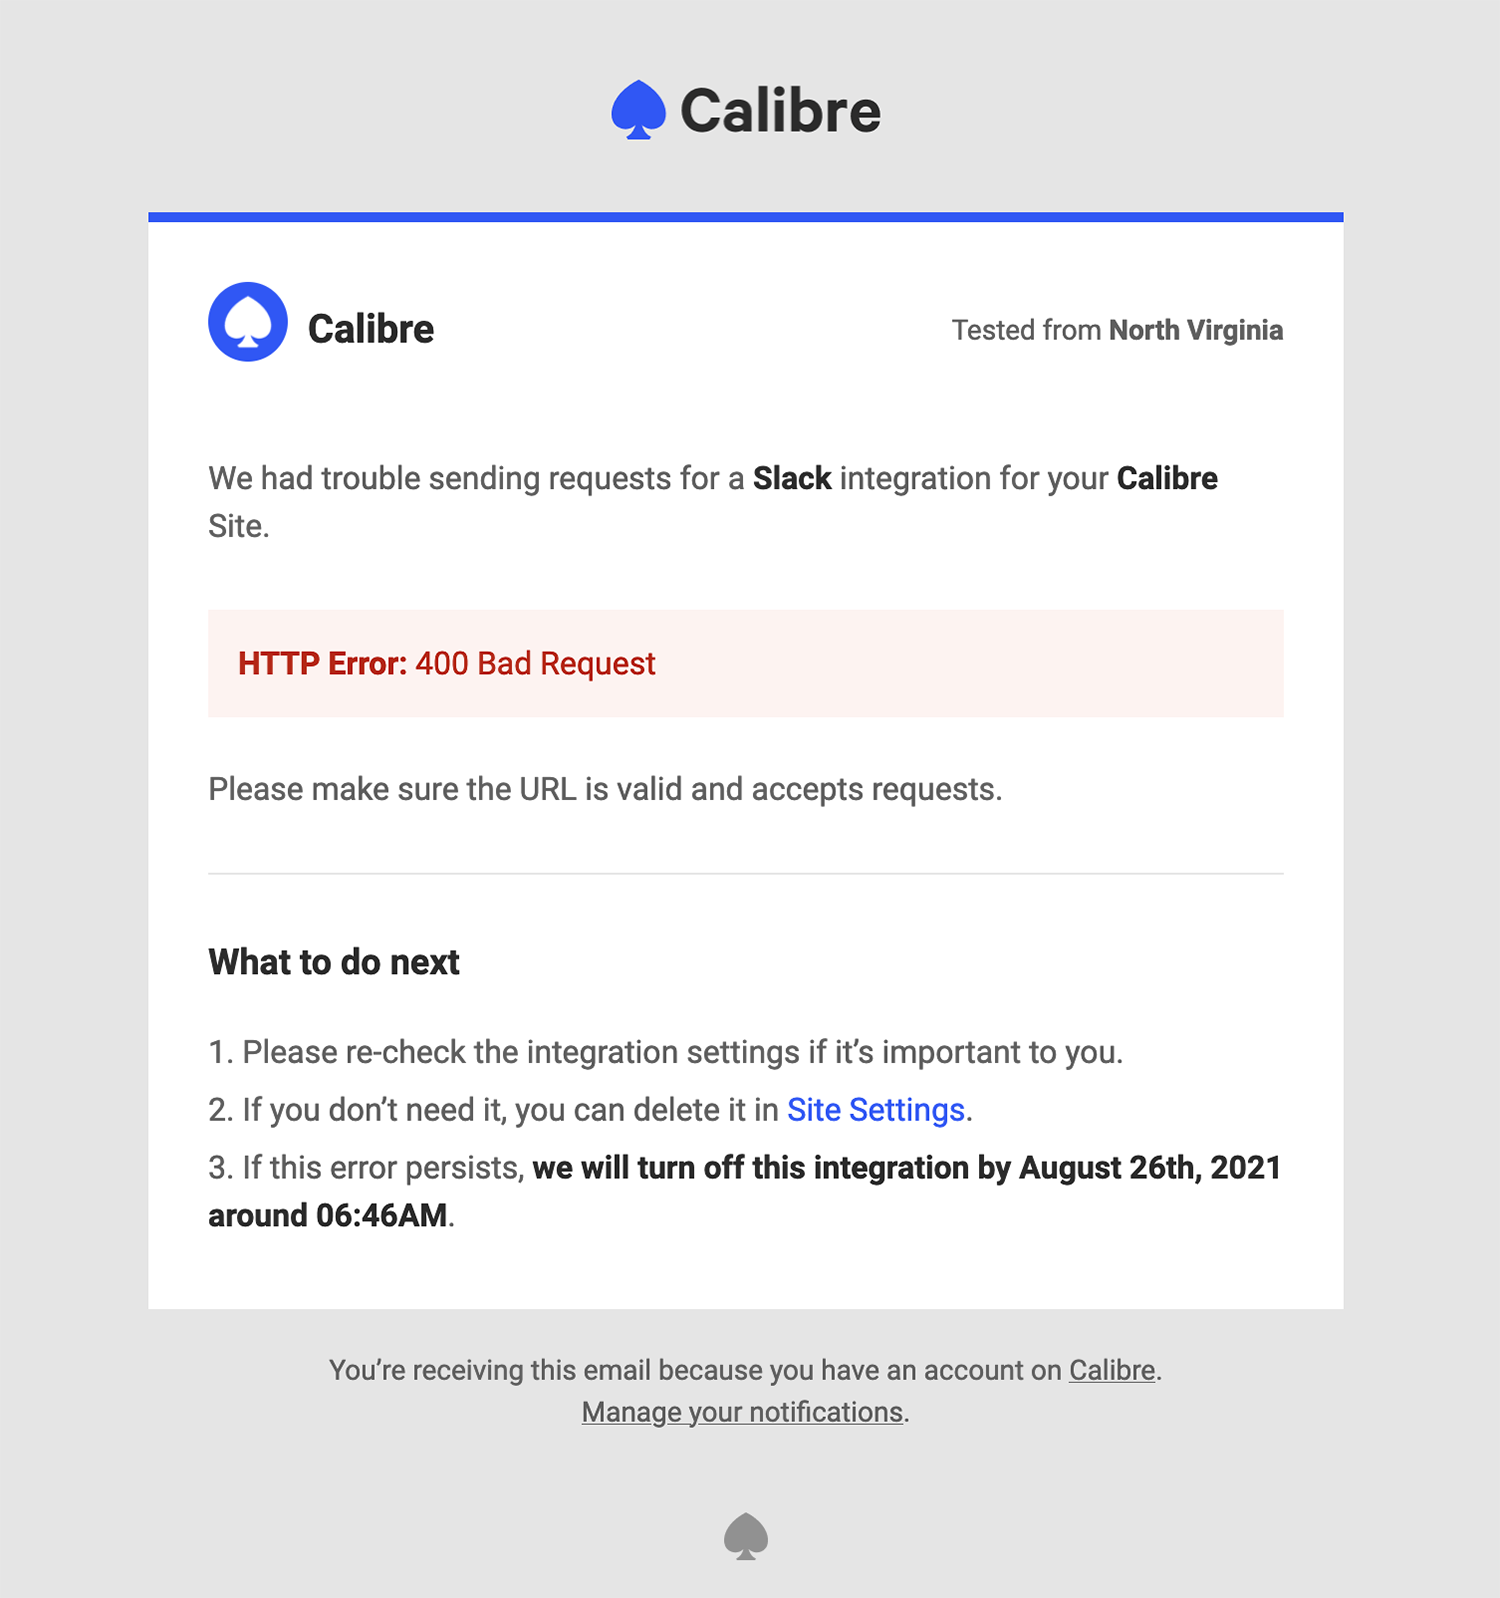
Now, Calibre sends you an alert when there’s an issue with any of your connected services (such as Slack, Webhooks, GitHub, Netlify) with steps to fix. No more discovering data or notifications aren’t being sent days later!
Lighthouse 8.3
Our Test Agents now use Lighthouse 8.3. We upgrade to stable Lighthouse releases as they become available so that you can leverage the newest version.
Pull Request Reviews: ignore drafts, branches and request tests with a comment
We’re continuing to improve our GitHub integration by adding more options to skip tests or run them on-demand—whenever it suits your development cycle. Now, you can ask Calibre to test (or re-test) your work by posting a comment with @calibreapp run. Similarly, you can say @calibrepp stop to halt future tests in that PR. Too easy!
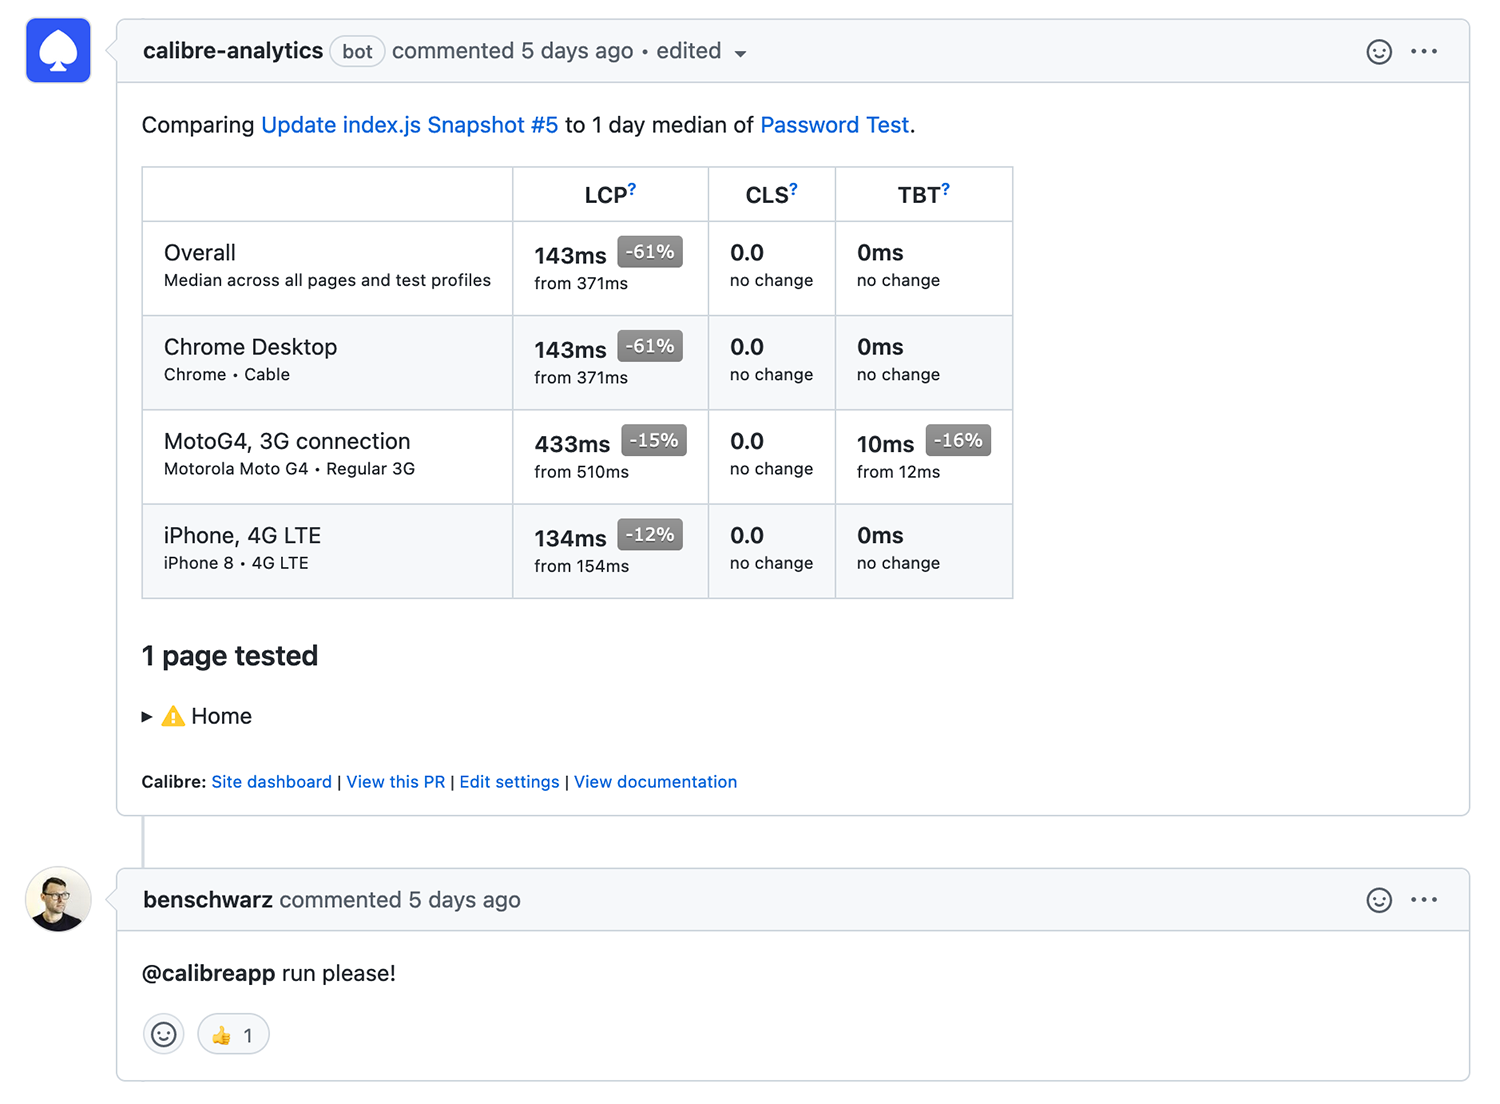
There are other situations when you might want to skip testing too. By default, Calibre won’t test draft Pull Requests anymore—only ones ready for review.
You can also use positive and negative patterns to specify which branches should be tested or omitted in Site → Settings → Edit a GitHub Integration. For example, ignore dependabot-generated branches or only test release branches:
Open source: React Live Chat Loader supports Chatwoot
React Live Chat Loader now supports Chatwoot and five other live chat providers. If you’d like to decrease the negative speed impact of live chat, install react-live-chat-loader through npm and implement it in your React application.
Metrics: Web Vitals are now default metrics
Previously, we displayed Performance Score, First Contentful Paint and Time to Interactive as default metrics in Calibre. This meant that you’d see those three metrics across Your Sites, Pulse, Pages Leaderboard, Pull Request Reviews and Insights reports. Now, Web Vitals (Largest Contentful Paint, Cumulative Layout Shift and Total Blocking Time) are the default metric set.
Web Vitals are now the default metric set, which means you will see them prominently displayed across all Calibre reports.
Web Vitals have been actively improved for several years and provide a holistic view on different aspects of user experience. Google also uses them as ranking signals for page experience. You can see Web Vitals across the previously mentioned areas. You can still customise metrics displayed in Pull Request Reviews, Pages Leaderboard and Pulse if you’d like to amend them. All measurements are colour-coded, so you know if they’re good (green), need improvement (orange) or poor (red).
In the future, we’ll be introducing more ways of view and metric customisation, as well as keeping track of KPIs.
Security: Easily delete your account
We know it’s essential always to control your data and be able to delete your account without needlessly contacting support. Now, you can delete your personal account in two clicks if you don’t want to use Calibre anymore.
Lighthouse 8 and Chrome 91
Our Test Agents now use the latest Lighthouse 8 and Chrome 91 to test your Sites. Lighthouse 8 comes with a few notable changes to metric collection and Performance Score calculation. Here’s a handy explainer of what you might notice in your metrics.
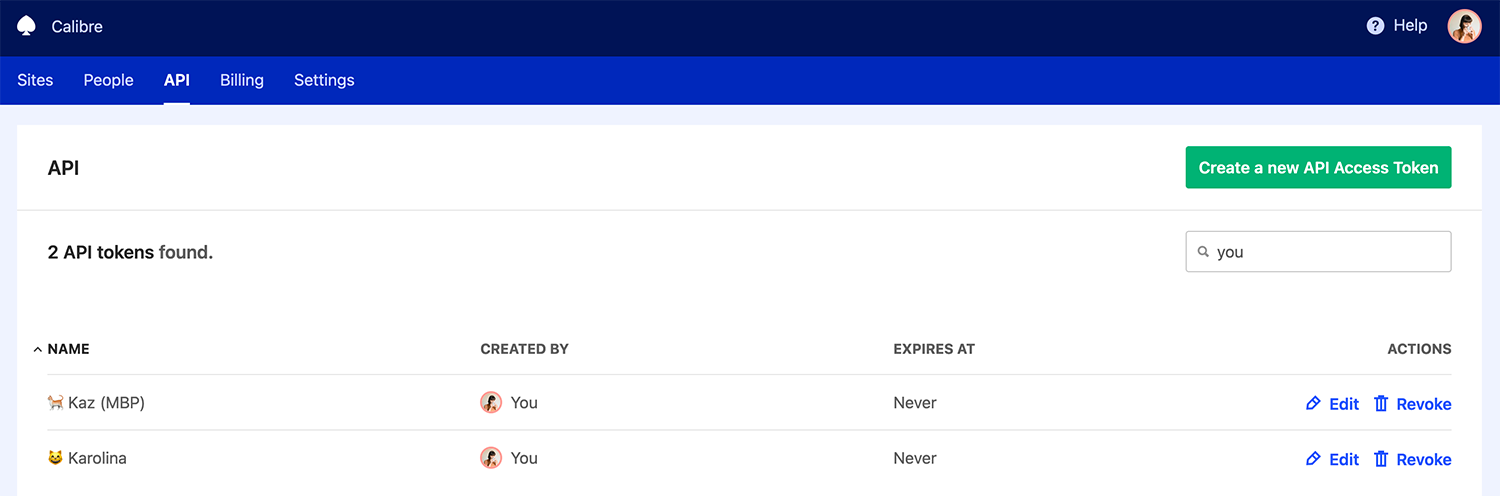
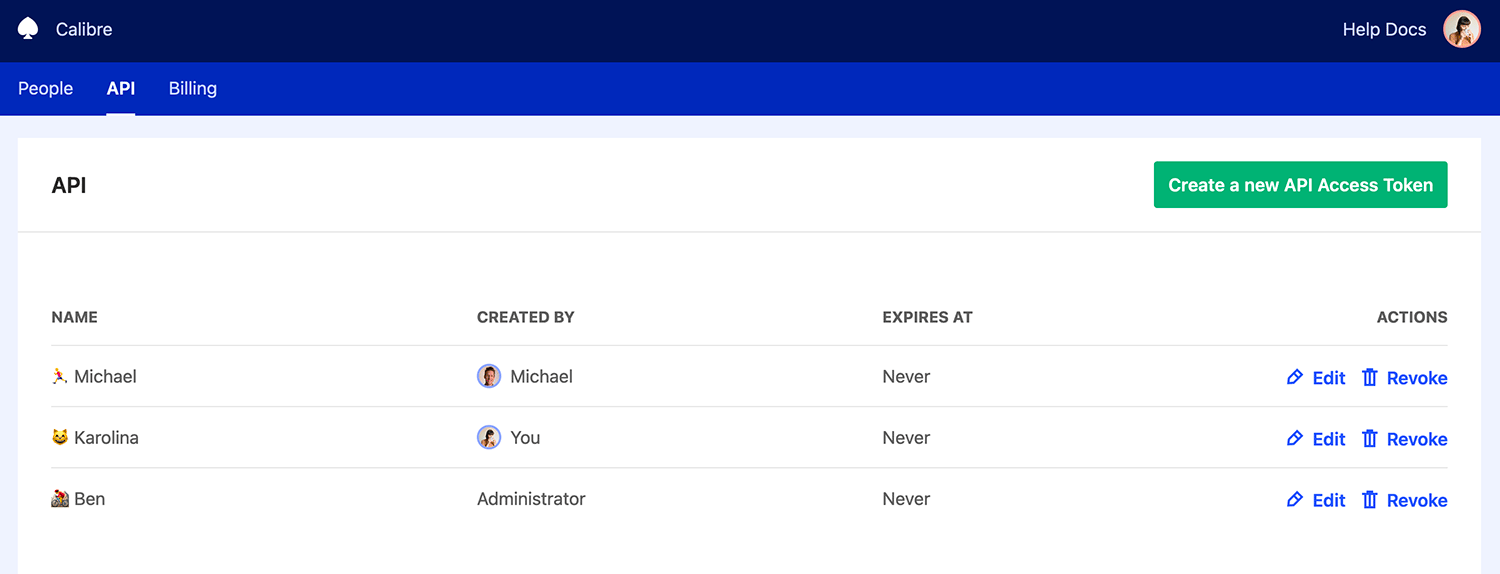
API: Use the API no matter your role
We introduced Personal Access Tokens (PAT), so anyone with a Calibre account can use the CLI and Node.js API to retrieve monitoring information and set up automations:
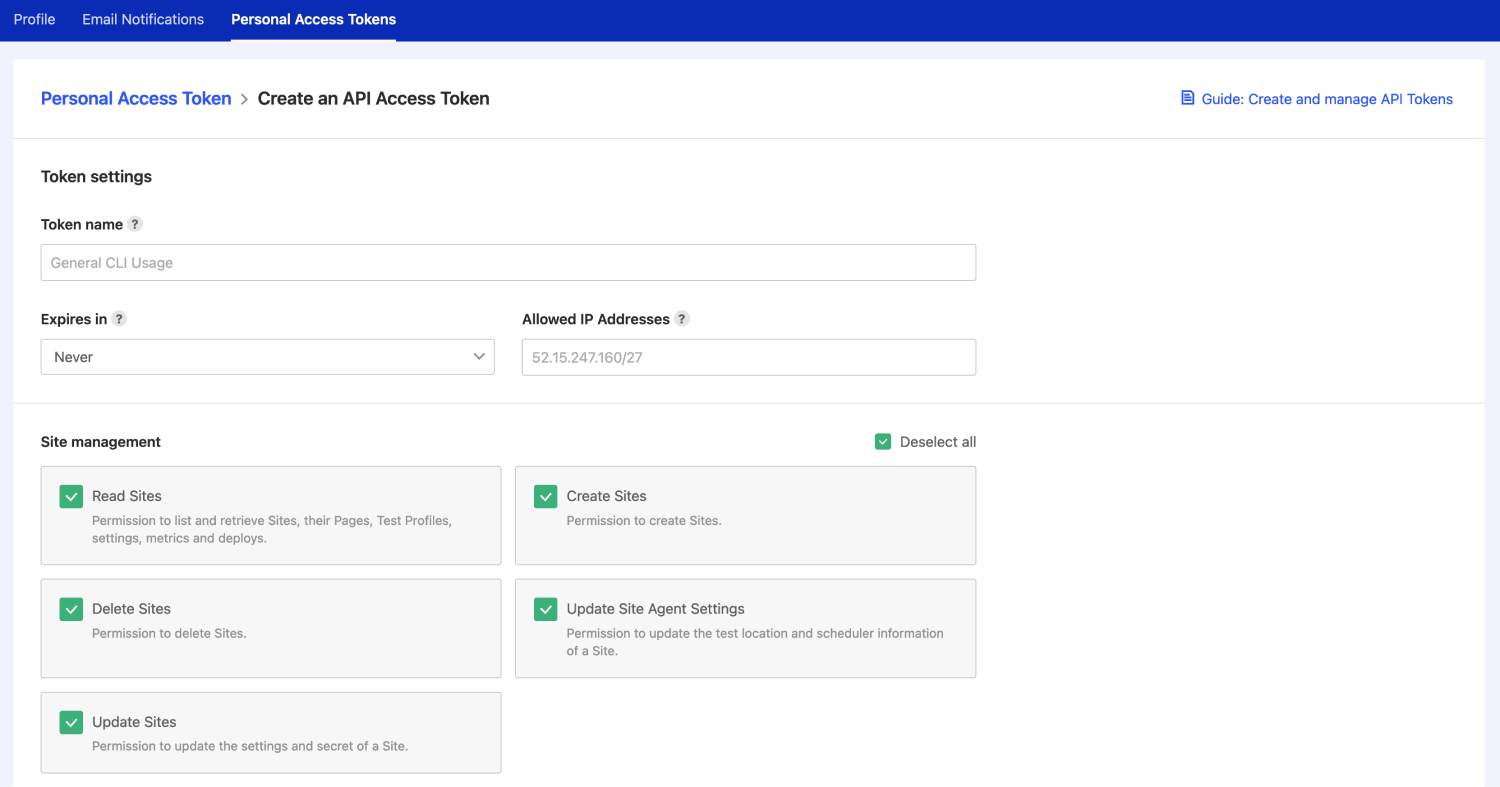
Creating a Personal Access Token in Profile Settings.
Before, only organisation administrators could create API access tokens, which created a need to give admin privileges to people who shouldn’t necessarily have access to other admin-only areas such as Billing and People Management. Now, anyone within your organisation can create a Personal Access Token with the level of permissions that mimics their account access level. With the introduction of PATs, everyone gains access to Calibre’s APIs.
Administrators can keep track of and manage all access tokens in the API tab:
API tab showing several API Tokens with their types and creator.
Personal Access Tokens will become even more helpful with the introduction of Teams. Not only the newly introduced Viewers will be able to retrieve data, but also Calibre will scope everyone but the admin’s access to the Teams they belong to.
Lighthouse 7.4
Our Test Agents now use the latest Lighthouse release, 7.4. We upgrade to stable Lighthouse releases as they become available so that you can leverage the newest version.
Open source: React Live Chat Loader supports Userlike
React Live Chat Loader, our open source project that helps mitigate the negative performance impact of live chat tools now supports Userlike. You can install react-live-chat-loader through npm and implement it in your React application.
Curious how significant the speed impact of using React Live Chat Loader can be? We sped up our Time to Interactive by 30%.
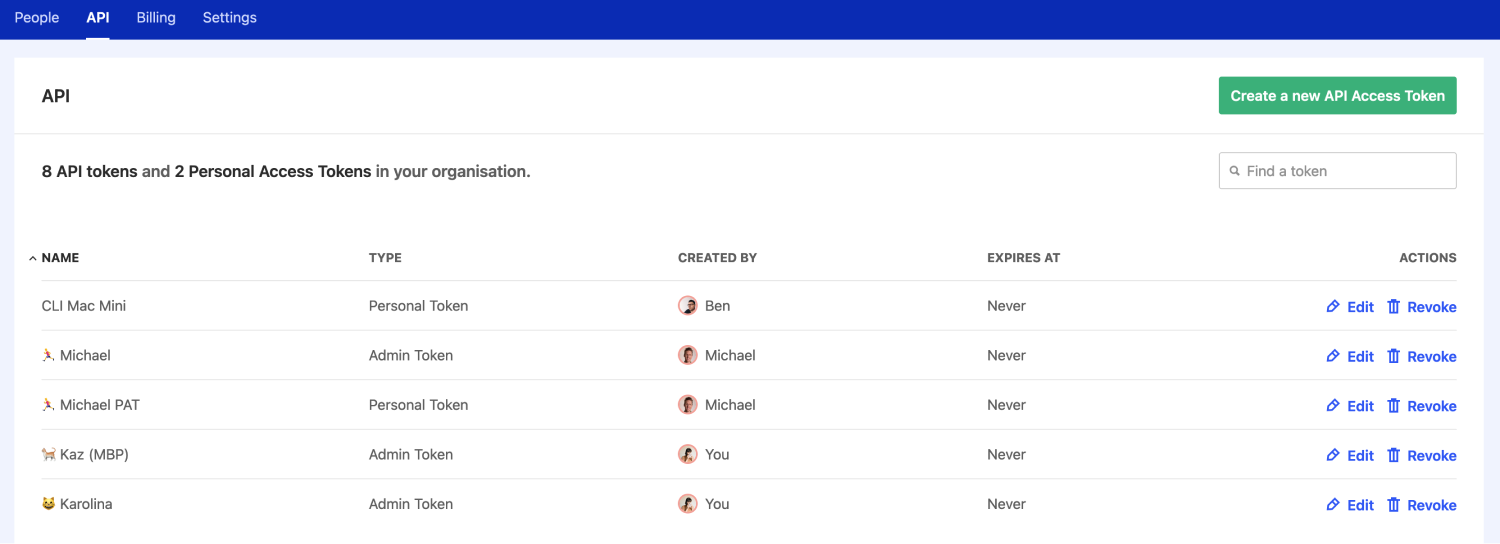
Admin tools: Find and sort your API Tokens
Following the API Tokens refresh in January 2021, we added more capabilities to make managing your access tokens straightforward.
API tab showing a list of API tokens with their name, creator, expiry date and actions.
Now, you can sort the tokens by name, creator and expiry date by clicking the respective headings. You also can easily find the token by searching for its name or creator in the search field in the upper right-hand side corner.
Admin tools: Efficiently manage people in your organisation
We refreshed the way you see and manage people within your Calibre organisation. You can now quickly find a person by searching for their name, email, role or authentication method. You can also sort the information by clicking the table column’s name to, for example, see who is an administrator.

People tab showing a list of people in your organisation with their name, email, role, authentication method and last seen.
You can still edit, remove and invite new people to collaborate on performance, just more easily.
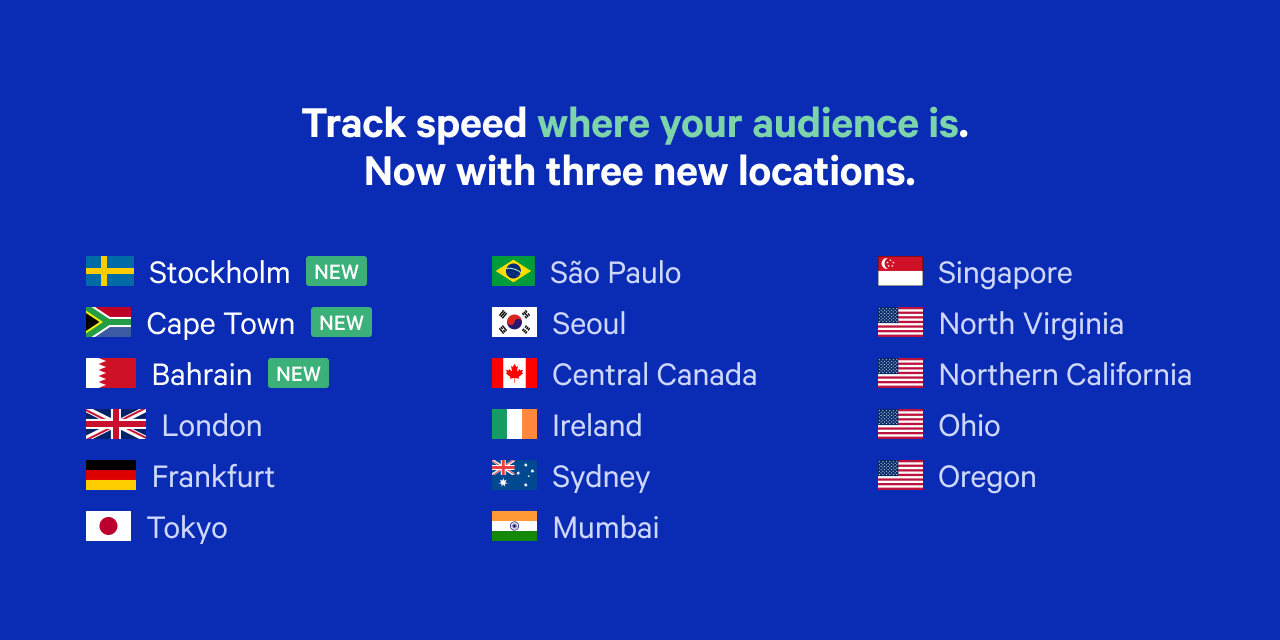
Test your Sites from new locations
It’s critical to test speed from various contexts that reflect your audience. performance will differ drastically depending on devices, latency, and location. That’s why we added three new test location regions:
- Stockholm, Sweden
- Cape Town, South Africa
- Bahrain
You can change your tests’ location in the Settings → Test Agent → Test location field or when creating a new Site. Find a complete list of Test Agent locations and their static IP addresses here.
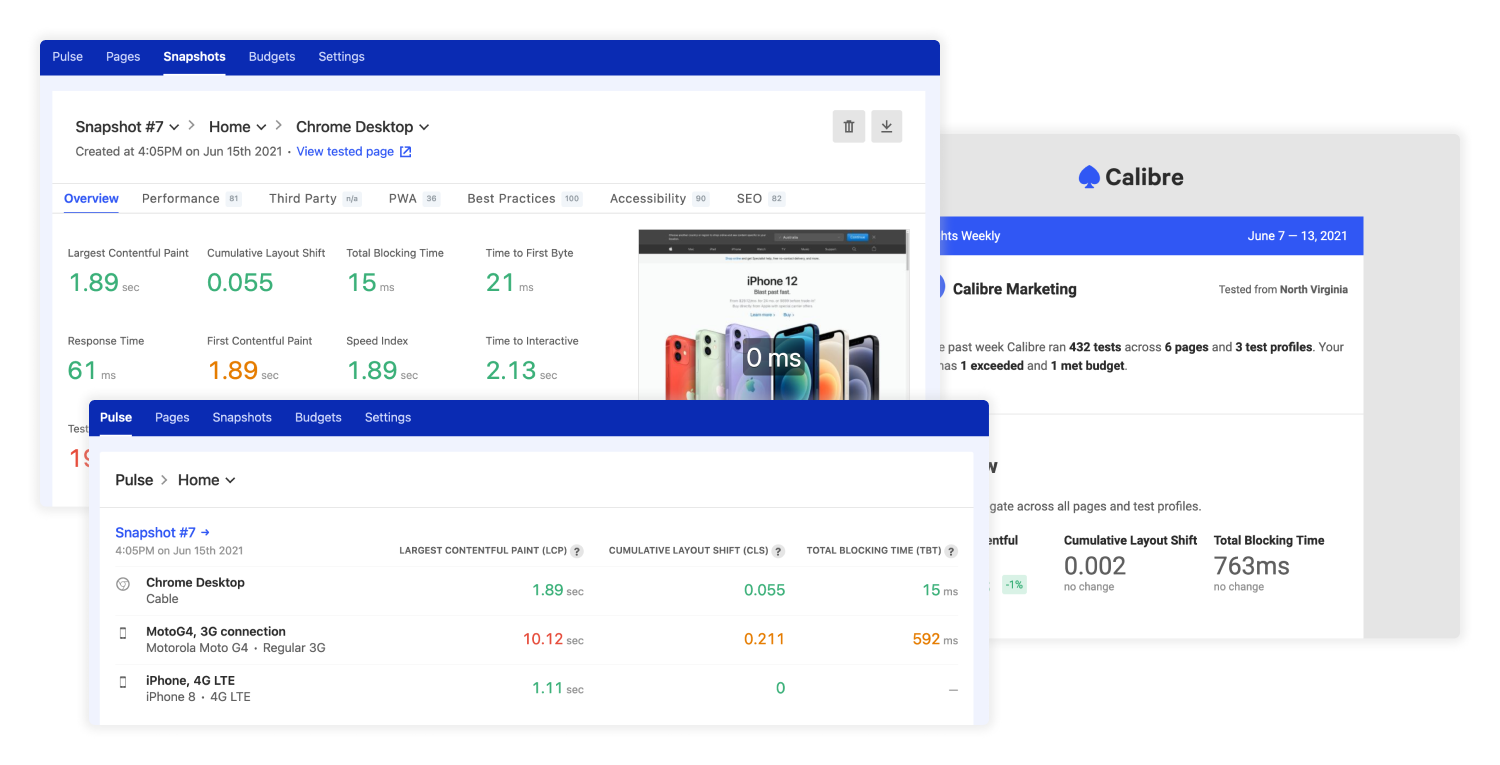
Snapshots: Easily see the status of your tests
We refreshed Snapshots page, listing all of the tests for a given Site. Now, you can clearly see the test status (Scheduled, Testing, Verifying, Completed or Failed) on per-Snapshot and per Page and Test Profile combination basis.
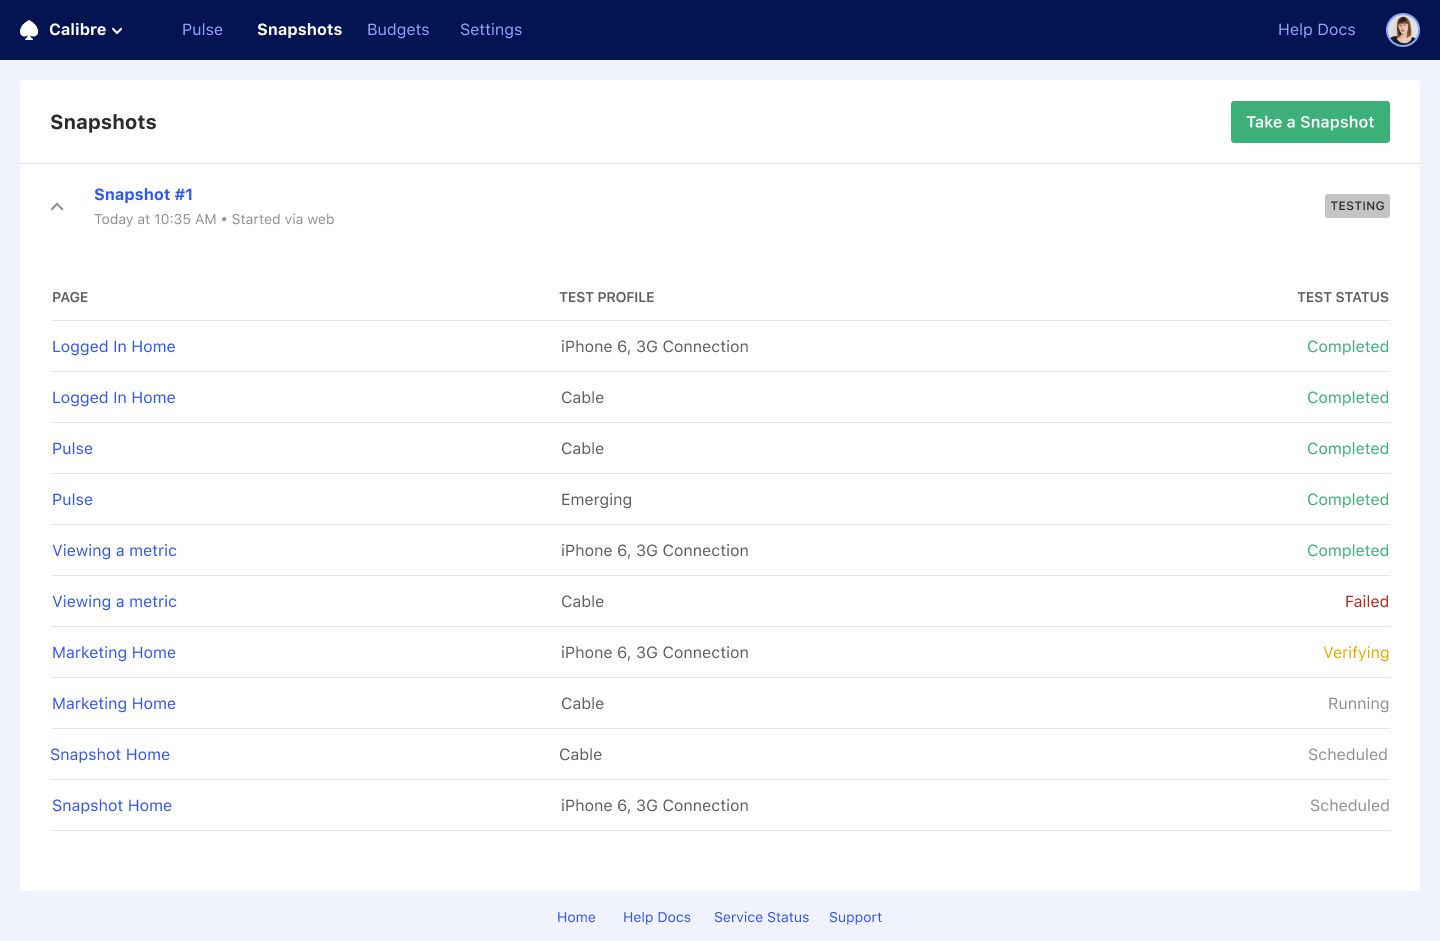
See the progression and status of your tests as Calibre completes them.
If you want to know how a Snapshot was started (manually through the interface, through previously configured test scheduler or API integrations) or investigate test status, Snapshots page is the best place to find it
Authentication: Specify all selectors when authenticating to protected Sites
Calibre can log into your Sites and applications as if it was one of your users. Until now, when using Form Authentication, we could specify the form, username and password CSS selectors, but not the submit button selector. Our Test Agent would then crawl your Sites to submit the form and successfully log in.
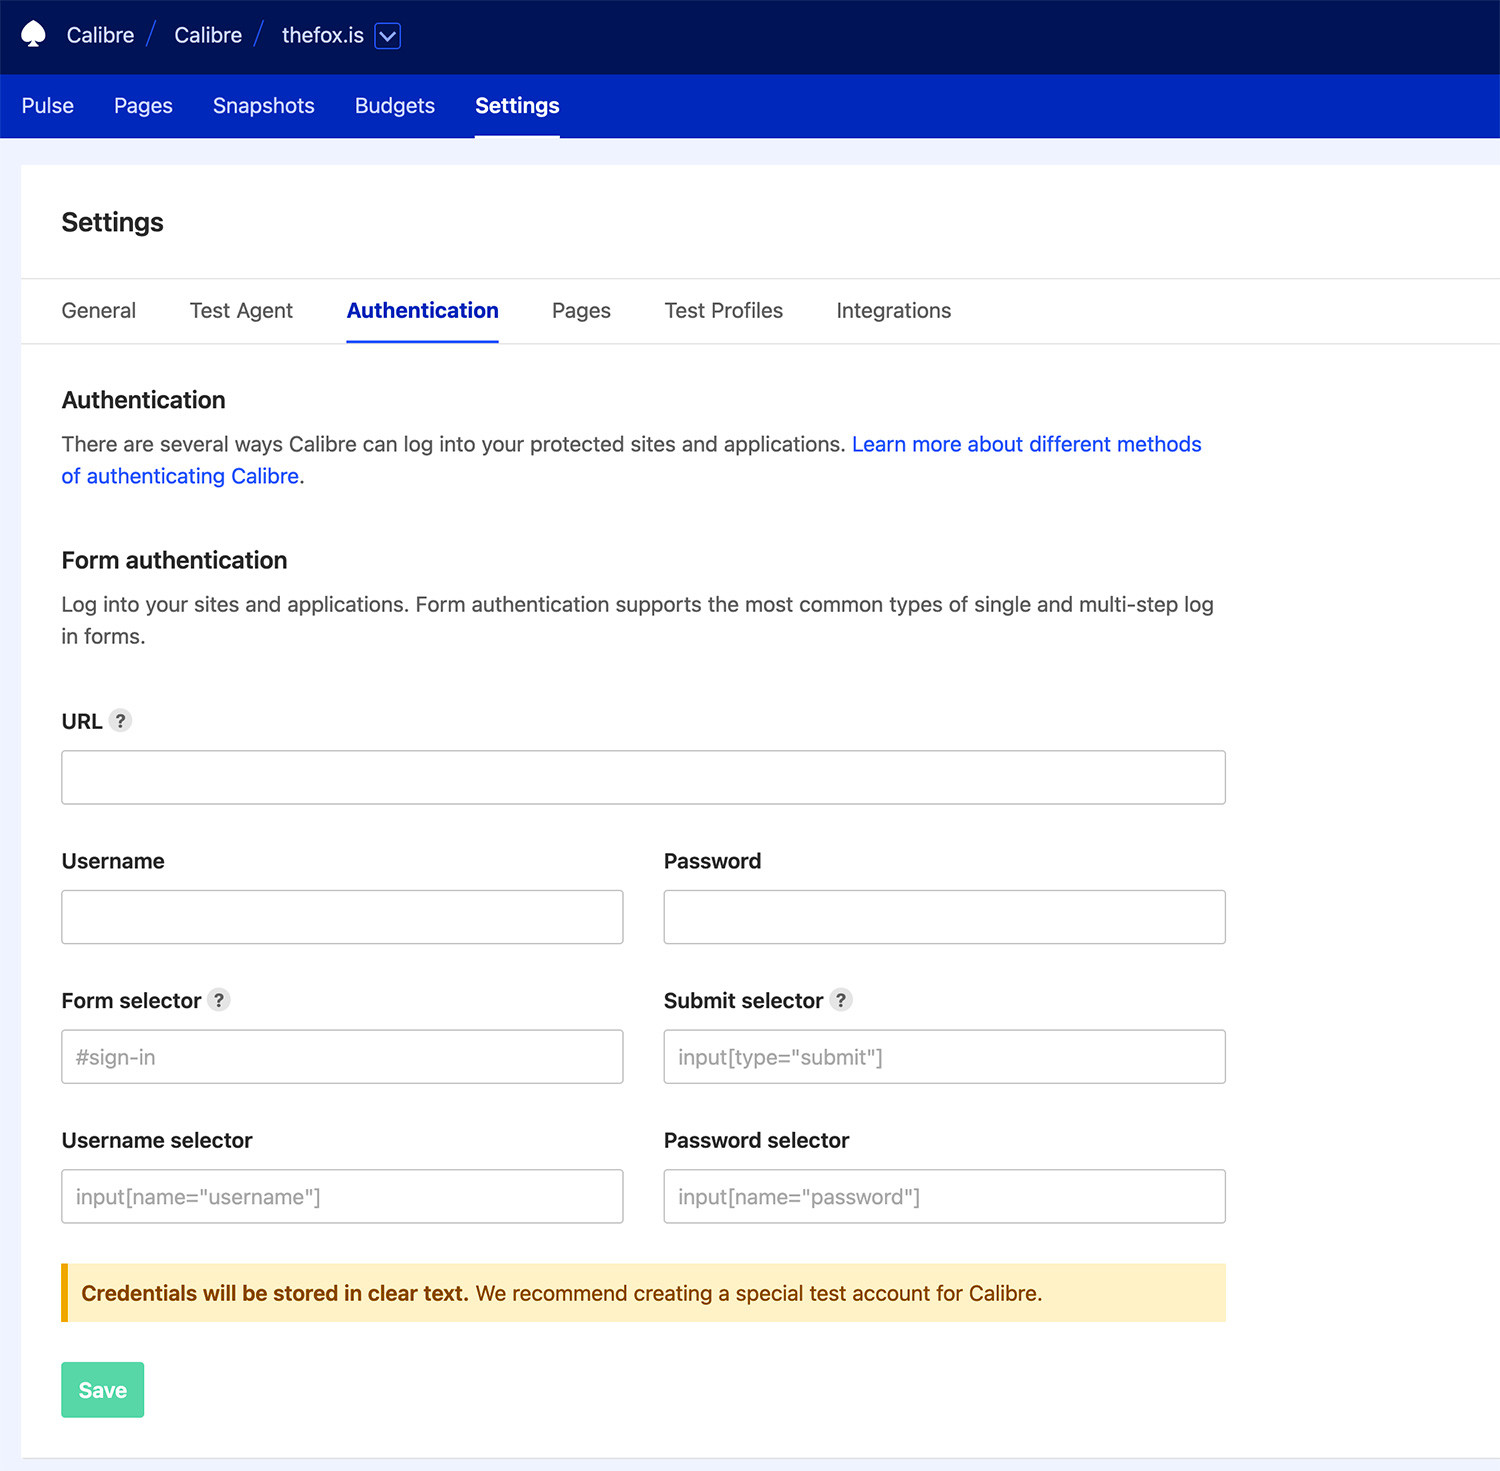
Form Authentication settings showing CSS selectors, username and password we provide to test protected Sites and apps.
This process wasn’t bulletproof, especially in tracking competition scenarios where you can’t make improvements to the markup. You can now specify the Submit selector, so there are no failed tests due to markup mismatch. You have full control over selecting which elements should be interacted with when authenticating.
Chrome 89
We updated Calibre’s Test Agents from Chrome 88 to Chrome 89. The latest version comes with metric improvements to Cumulative Layout Shift and First Contentful Paint.
Chrome 88
We updated Calibre’s Test Agents from Chrome 84 to Chrome 88. Because of numerous fixes and changes to the Largest Contentful Paint metric in versions 86 and 88, you will likely see changes to your Largest Contentful Paint (LCP) measurements.
Lighthouse 7
Our Test Agents now use the latest Lighthouse release, 7.0. As always, we upgrade to stable Lighthouse releases as they become available so that you can leverage the newest version.
This is the first major version release since Lighthouse 6 in May 2019, including numerous significant changes, including new audits. As outlined by the Lighthouse Team, you might see PWA and Accessibility scores changes.
Pull Request Reviews: Filter by environment
If you are using Pull Request Reviews to track speed before releasing to production, you can now trigger tests only based on a specific list of environments, so the reports in GitHub always relate to what matters to you most.
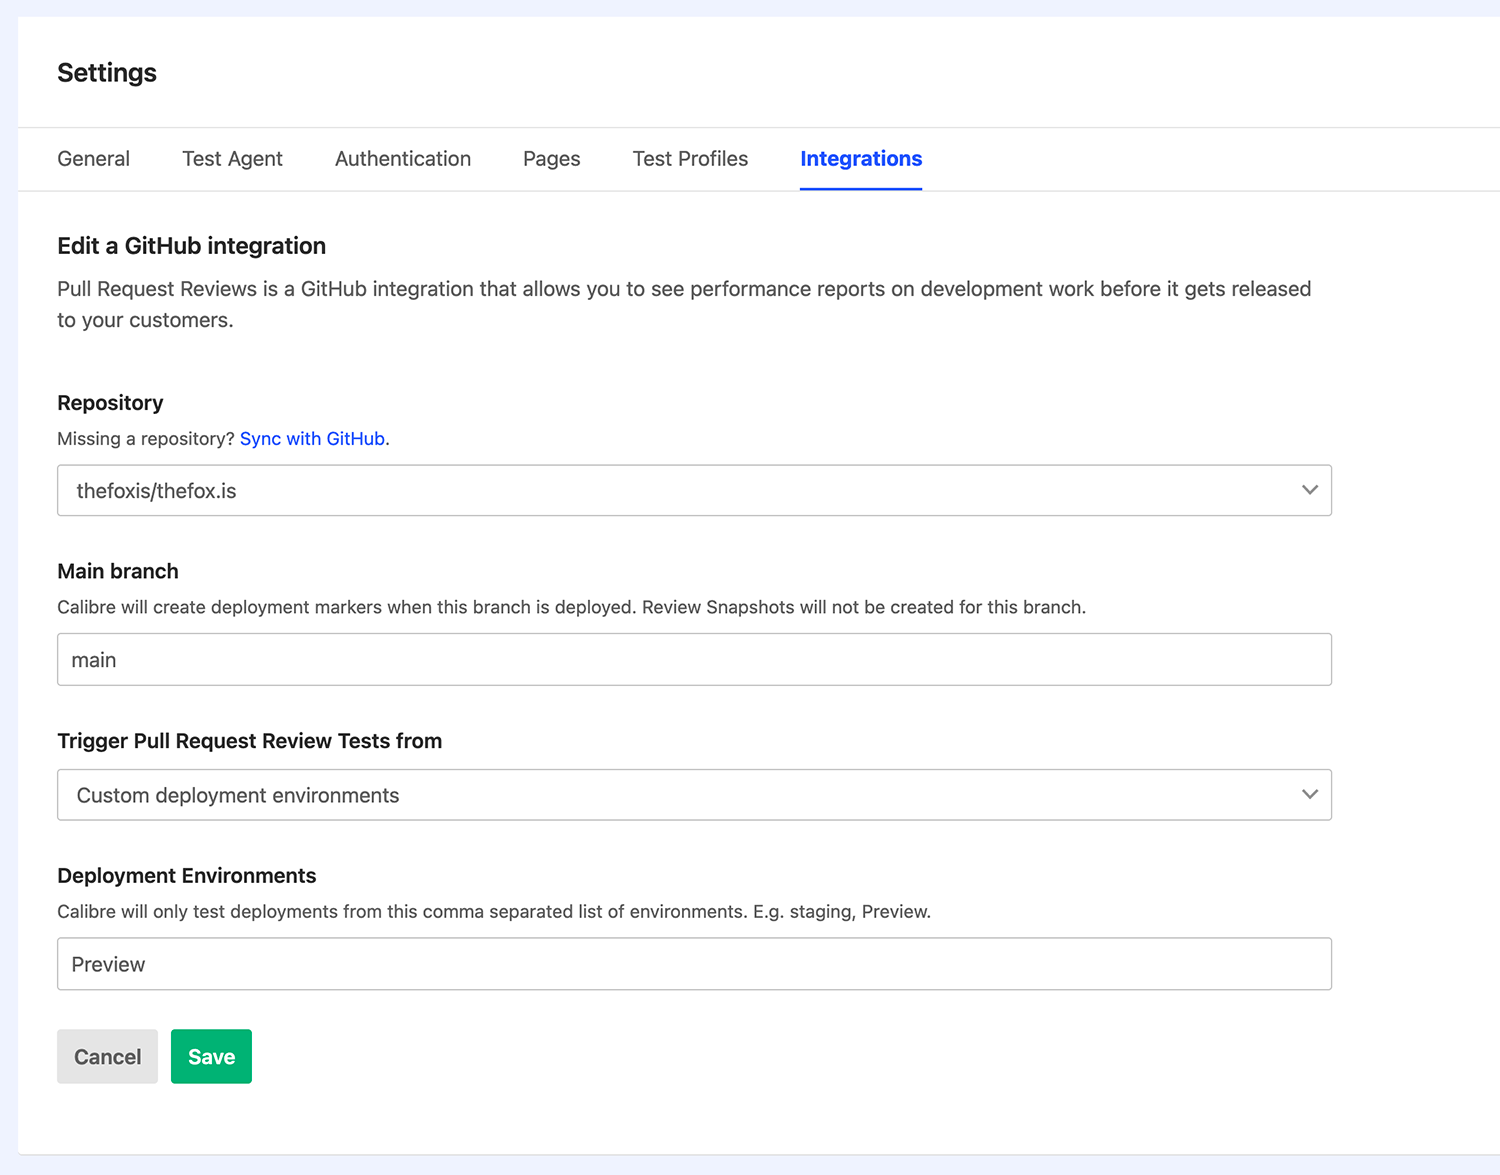
Editing the GitHub integration to recognise a specific deployment environment.
This is especially helpful when using one deployment provider to release multiple projects or sites. For example, at Calibre, we deploy our marketing website using Vercel. Each deploy publishes a preview of the website and our design system in Storybook. We specify the deployment environment to match the marketing website, so our Pull Request Reviews analyse the website, not Storybook.
API: Seamlessly control API access
We refreshed how you manage and generate API Tokens used to authenticate your account when building automations with our APIs. You can see all tokens for your organisation in the API tab, including their creator and expiration.
API tab showcasing API Tokens for the organisation, who created them and their expiration dates.
When creating a new API Token, you can easily select the areas it should access. We display the new token only once, so it’s essential to save it in a password manager straight away. You can also manage your tokens via the CLI and APIs.