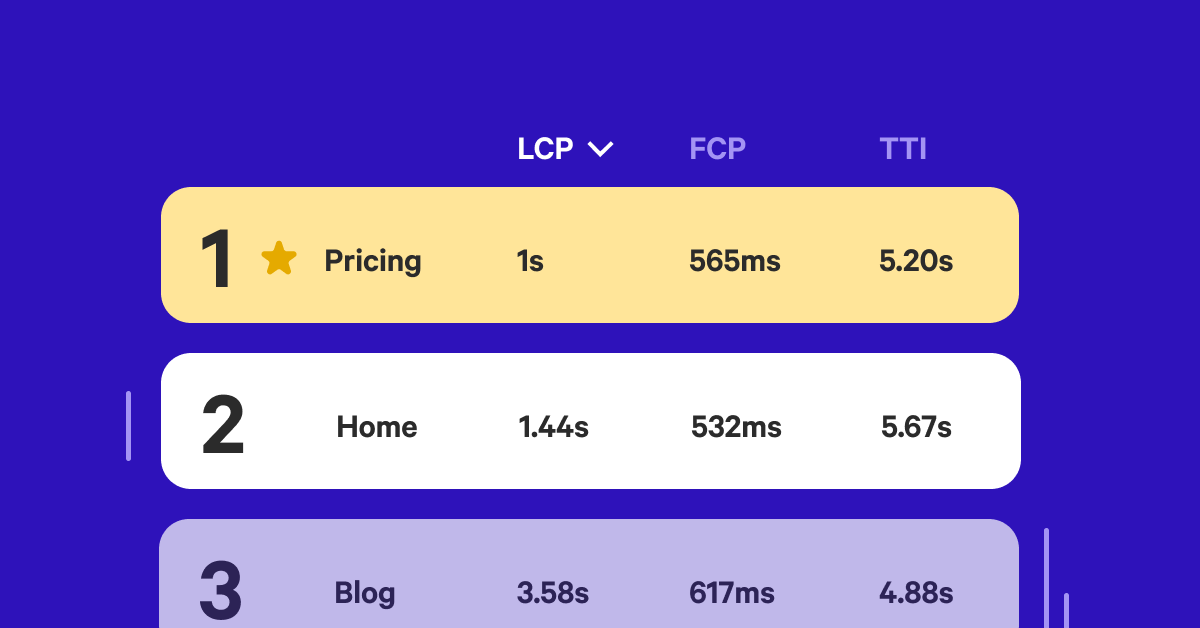

We created the Pages leaderboard so you can identify fast and slow areas of your Sites quickly.
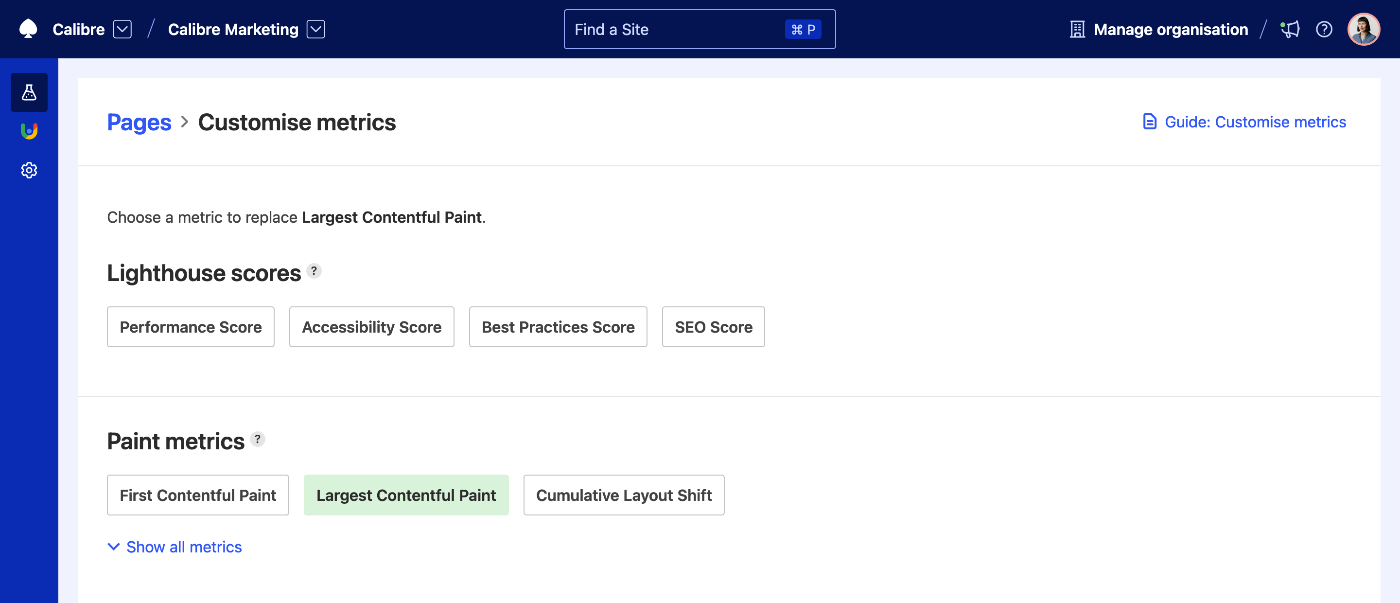
By customising metrics, you can stay aligned with your organisational KPIs and uncover potential areas for improvement by analysing a specific subset of performance, such as request or runtime metrics.
Currently, customisation settings will persist for the person who set them, so if different people on your team have varying performance objectives, they can tweak the Pages leaderboard accordingly to their needs. Calibre surfaces the most critical metrics in each area of focus to make the selection as straightforward as possible.
Benchmark against your competitors#
Another way you can use the Pages leaderboard is as a comparison tool against your competitors. To do so, create a Site containing your own and competitor pages (for example, you can start with tracking home or landing pages).
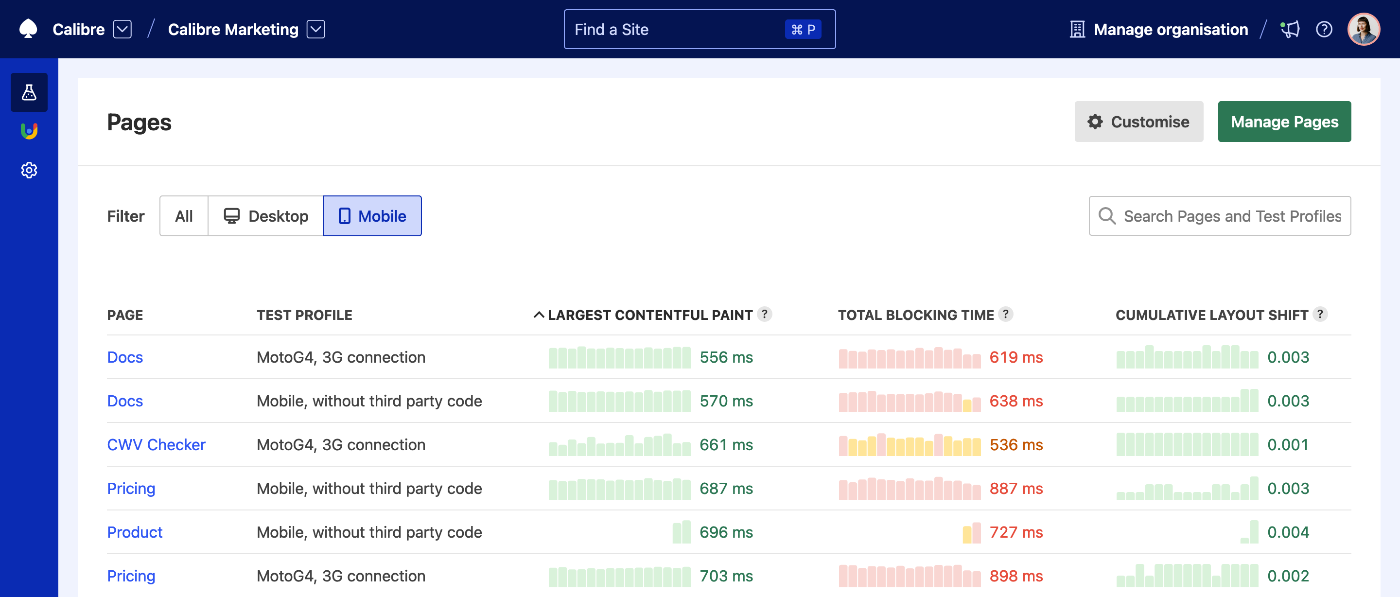
In the Pages leaderboard, you will be able to see how you stack up against your opponents based on critical metrics and device profiles.
Looking at speed on a per-Page basis will help you uncover fast areas and those that need improvement. Based on your metric selection, you will be able to find previously hidden issues, such as potentially slow response times or long JavaScript tasks blocking the main thread. Being able to see the performance at a high and granular level will enable your team to prevent releasing localised regressions.