

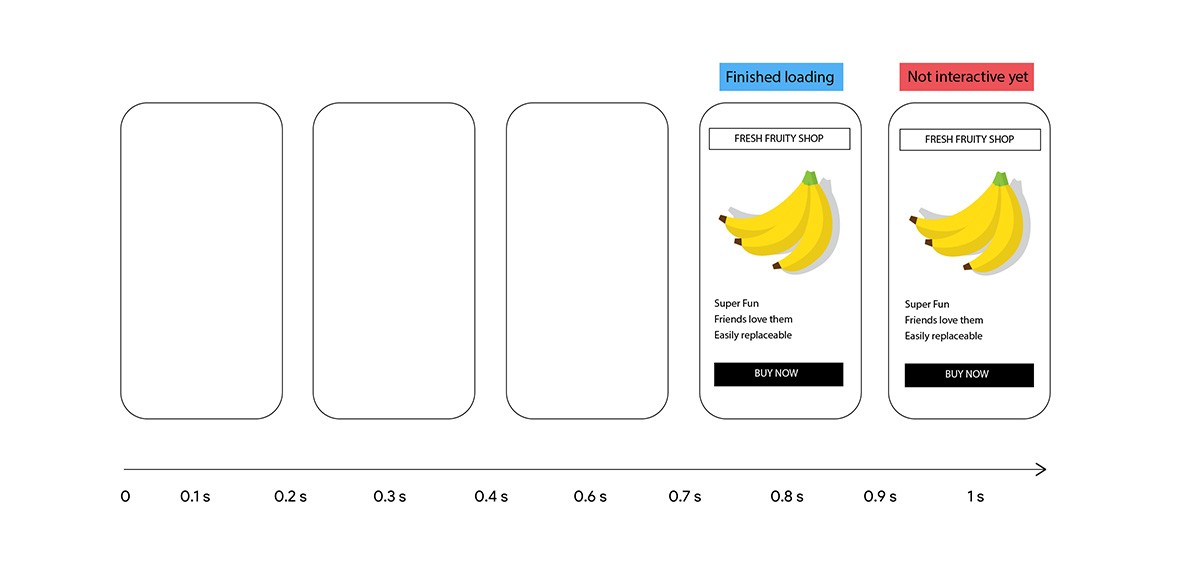
Traditional performance metrics like load time or DOMContentLoaded focus on details that are easy to measure, but these milestones don’t translate well to what the users care about. If you optimize only for fast loading time, you can quickly end up with sites that still have a poor user experience.
A site can have fast total loading time, but if it blocks rendering until all of the content is ready users would be staring at a blank screen for a while. If clicking buttons doesn’t work because the main thread is overwhelmed with JavaScript tasks, they can get frustrated even though the page is technically “loaded”.
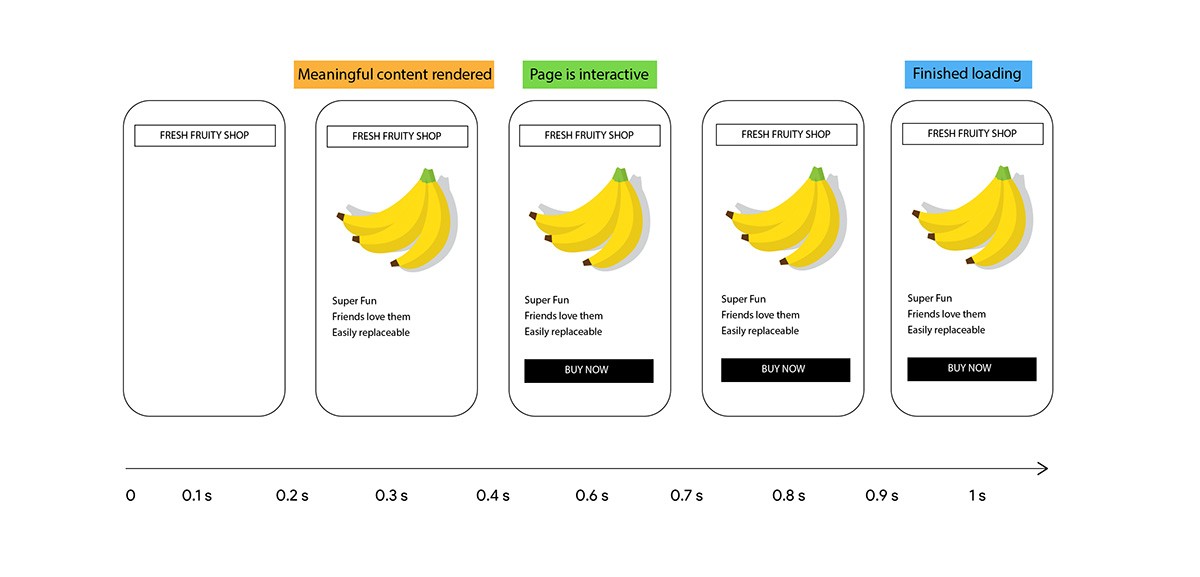
Compare the example above to a page that has longer total loading time, but renders content progressively and doesn’t block the main thread with excessive JavaScript. The user experience is much better, but loading time can’t tell you that.
That’s why user-centric performance metrics that focus on the user’s view of the browsing experience were created.
User-centric performance metrics measure how fast a page displays useful content, whether users can interact with it, and whether those interactions are smooth and free of lag.
What users perceive as a “fast” page is affected by different moments in the loading experience, so there are several metrics that try to capture that:
| User experience | Metrics |
|---|---|
| Is it happening? | First Paint (FP), First Contentful Paint (FCP) |
| Is it useful? | First Meaningful Paint (FMP), Speed Index (SI) |
| Is it usable? | Time to Interactive (TTI) |
These metrics brought us a step closer to measuring user experience, but none of them are perfect and the industry keeps researching and developing key indicators for what describes a good user experience. As understanding and ability to measure user experience evolve, the metrics need to evolve as well.
The result of this process are three new performance metrics that fill in the gaps in the user experience story:
- Largest Contentful Paint (LCP)
- Total Blocking Time (TBT)
- Cumulative Layout Shift (CLS)
Largest Contentful Paint#
Largest Contentful Paint (LCP) measures when the largest content element becomes visible in the viewport.
The largest element, for example, a big paragraph of text in an article or an image on a product page, is likely the most useful for understanding the content of a page. Thorough testing has proved that LCP is a good approximation of when the main content of a page loads.
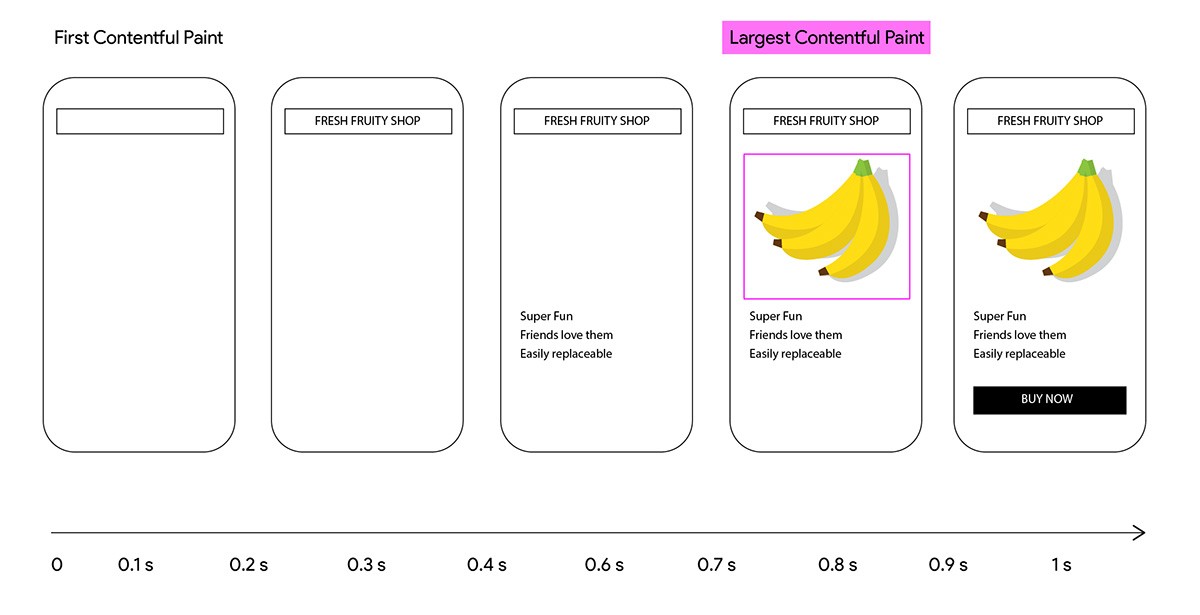
In the example above, LCP happens at around 0.8 seconds when the banana image loads.
To improve LCP, make sure to:
- Eliminate render-blocking resources.
- Minimize the critical request chain by loading resources with correct priorities and in the right order.
- Compress images and serve different image sizes to different devices.
- Optimize CSS by minifying files and extracting critical CSS
- Use font loading strategies that avoid the flash of invisible text (FOIT).
Why do we need LCP?#
Browser and performance monitoring tools have reported paint metrics for a long time. The goal has always been measuring the critical moments in users’ perception of page loading progress. However, some of the metrics that we know and love have some glaring flaws.
| Metric | Definition | Issues |
|---|---|---|
| First Contentful Paint (FCP) | The time when the browser renders the first piece of DOM content | - Often not relevant to users (for example, loading indicators and navigation bars). |
| First Meaningful Paint (FMP) | The time of the paint after the biggest layout change during page load | - Not standardized and difficult to implement across browsers. <br/>- Not accurate in about 20% of the cases. |
| Speed Index (SI) | Tracks the visual progress of loading the content in the viewport and averages the "completeness" of the page at various points in time | - Complex metric, not easy to explain. <br/> - Computationally intensive, so it’s not available for real-user monitoring (RUM) in any major browser. |
LCP, however, is:
- simple to understand
- relevant (gives similar results as SI)
- easy to compute and report in RUM tools
The fact that we now have LCP does not mean that other metrics were useless. FCP is still relevant because it gives users feedback that the page is actually loading. Experimenting with FMP provided valuable insights for developing LCP.
Largest Contentful Paint is available in Calibre, Chrome DevTools and through the Largest Contentful Paint API. In Lighthouse (starting at version 6.0) LCP will be used for calculating the Performance score. To learn more about how the score will be calculated and what’s changed from the previous version, check out the performance score calculator.
Total Blocking Time#
Total Blocking Time (TBT) describes the JavaScript main thread activity. It’s useful for understanding how long is a page unable to respond to user input during loading.
In most cases, all the work of rendering a website, running JavaScript and responding to user input happens on the main thread. If a user presses a button while the main thread is in the middle of another task, the response is delayed until the main thread is free. If that delay is small, for example, less than 50 milliseconds, the user won’t even notice. If the main thread is blocked for longer than that, the user can experience delays and page unresponsiveness.
TBT quantifies the time that the main thread spends tied up in long tasks, to estimate the risk of how much could long tasks potentially impact any user interaction that could happen during page load.
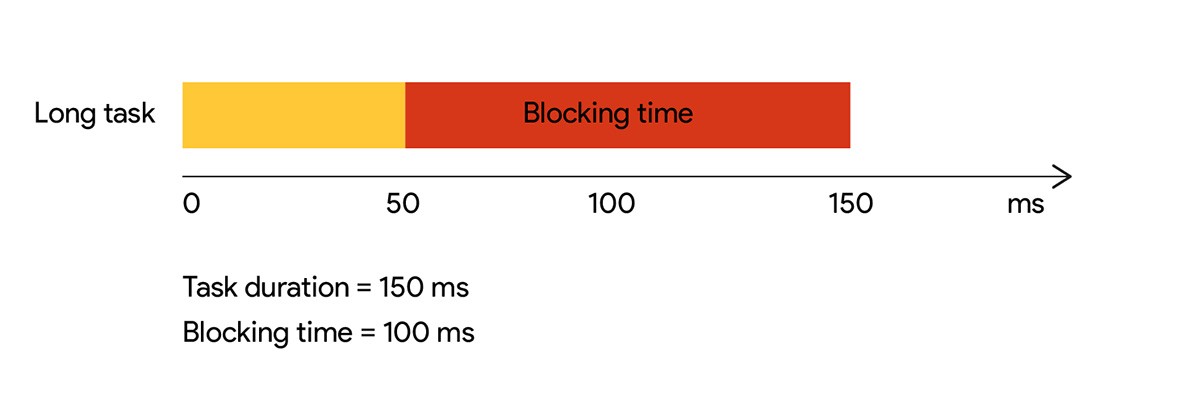
What is a long task?#
A task is long if it runs for more than 50 milliseconds on the main thread. Any time over that is counted towards that task’s blocking time.
The Total Blocking Time of a page is the sum of the blocking times of all long tasks that occurred between the First Contentful Paint and Time to Interactive.
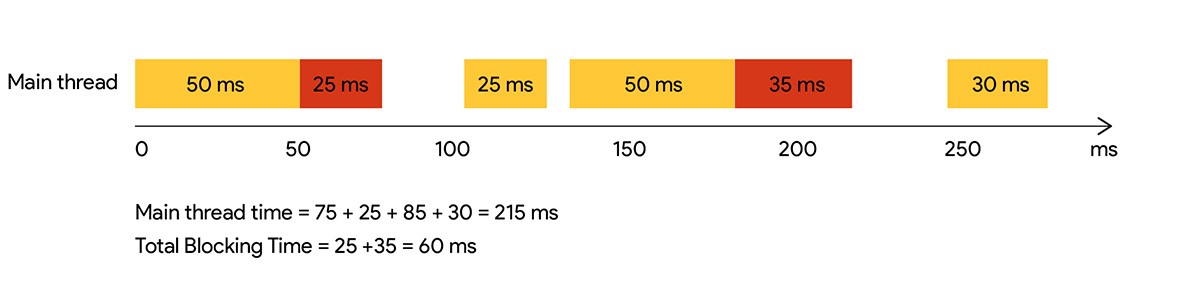
Here’s the breakdown of how TBT is calculated for the example above:
| Task | Task duration | Task blocking time (> 50 ms) |
|---|---|---|
| 1 | 75ms | 25ms |
| 2 | 25ms | 0ms |
| 3 | 85ms | 35ms |
| 4 | 30ms | 0ms |
| Total Blocking Time | 60ms |
Tracking TBT is the first step towards improving page interactivity. If you notice high TBT values:
- Code-split your JavaScript bundles and lazy-load the ones that are not critical to the initial load.
- Where possible, break up code into functions that do less work and execute faster.
- Reduce excessive DOM queries.
- Offload computationally intensive tasks to Service workers or Web workers.
What is the difference between Total Blocking Time and Time to Interactive?#
Time to Interactive (TTI) measures when the page becomes capable of reliably responding to user input. A page is considered to be “reliably interactive” if there are no long tasks on the main thread for at least five seconds.
Total Blocking Time is measured only between First Contentful Paint and Time to Interactive.
TTI identifies when the main thread becomes idle. TBT quantifies how busy the main thread is before it becomes idle.
TTI can sometimes be misleading, but when combined with TBT, you get a clearer picture of how responsive your page is to user input.
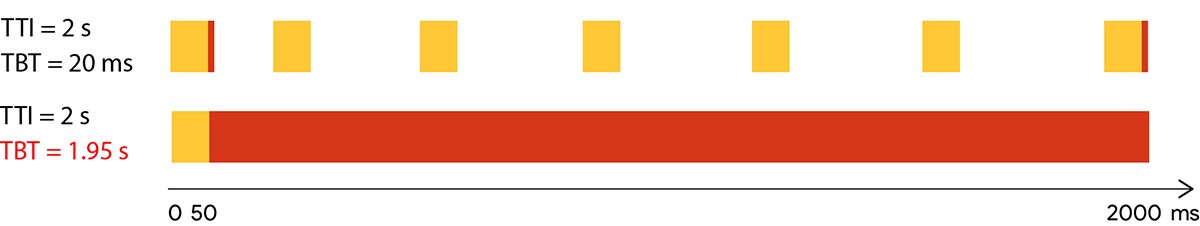
For example, two pages can have the same TTI, but if one breaks work into smaller tasks while the other hogs the main thread with one very long task, the user experience will be worse in the second case. That difference will be reflected in much higher TBT, as shown in the example below.
Total Blocking Time is available in Calibre and Lighthouse and like LCP, TBT will also be used to calculate the Lighthouse Performance Score when version 6.0 is released.
Cumulative Layout Shift#
Cumulative Layout Shift (CLS) quantifies how much elements within the viewport move around during page load.
Here’s an example where moving content (a prompt that loads at the top of a page and moves the main content down) can make a user miss the button they wanted to click:
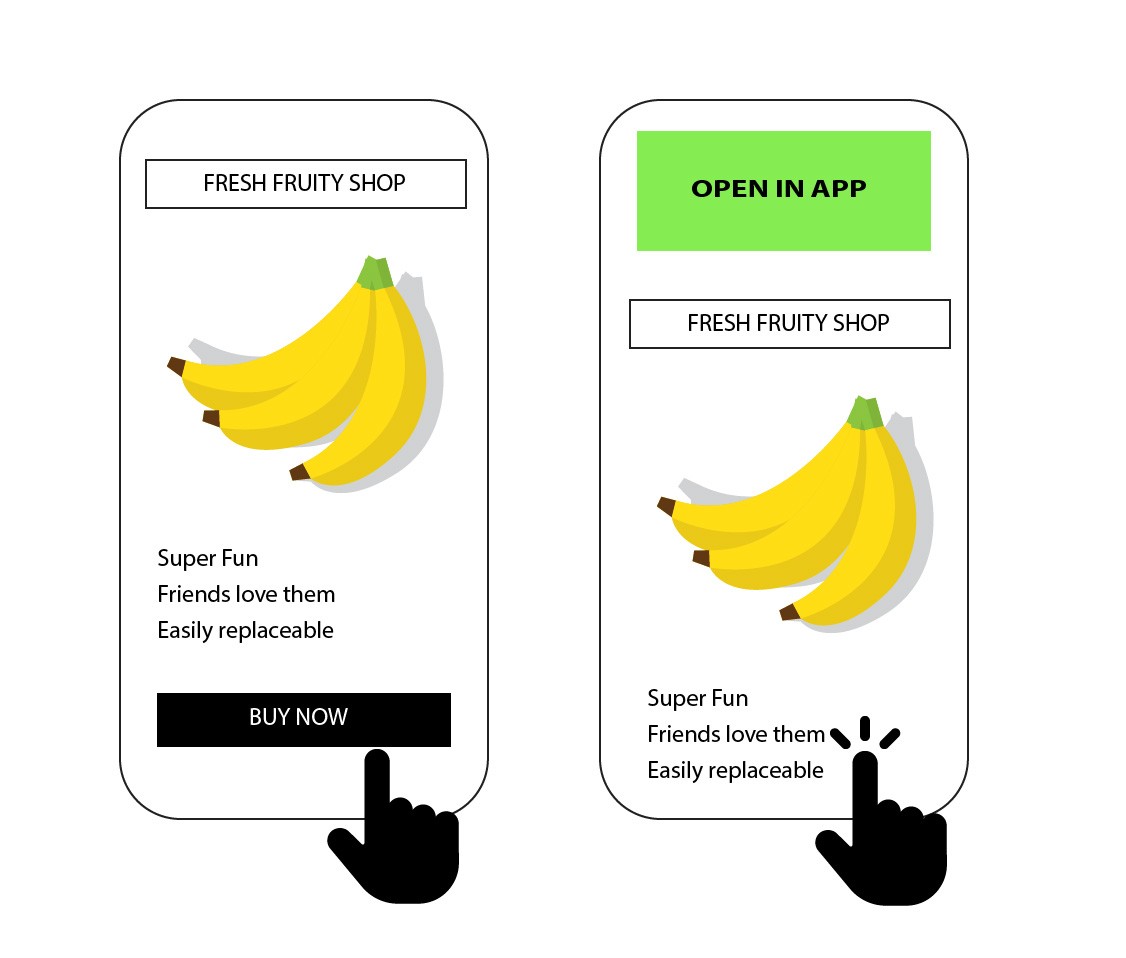
Even worse, this kind of content shift could cause them to click a button they didn’t intend to.
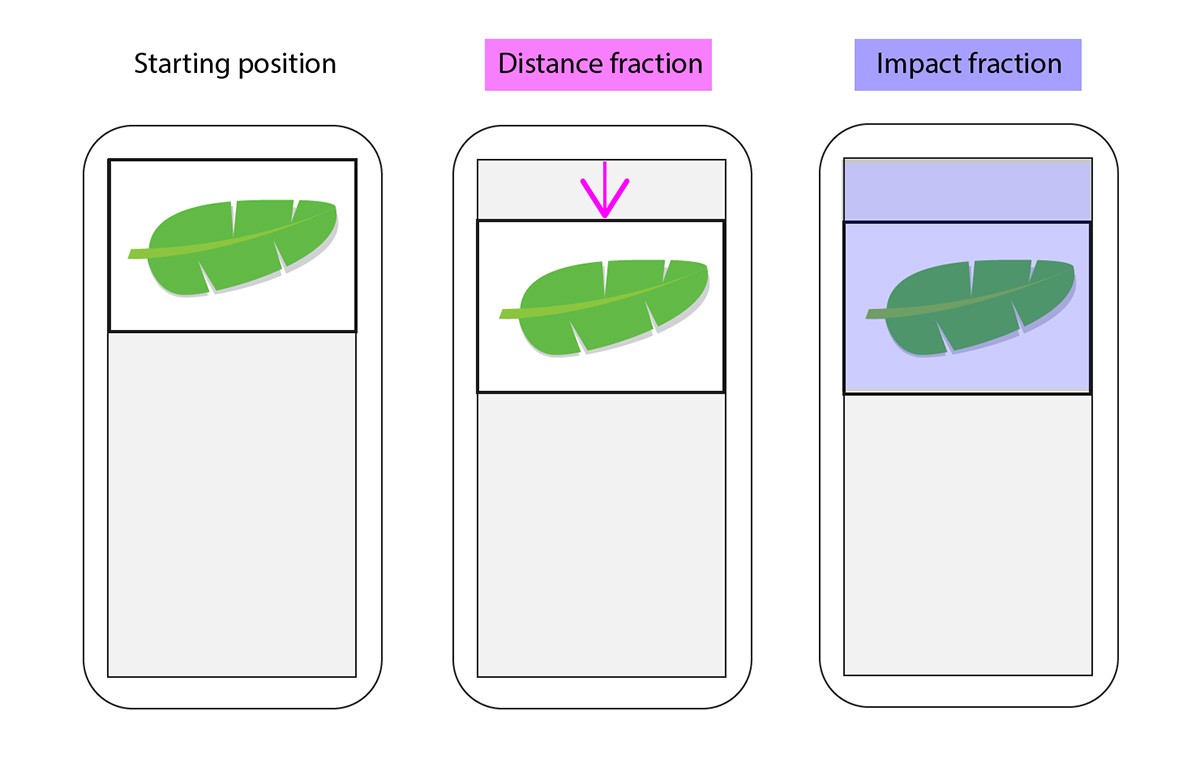
Here’s another example where page content shifting by a few pixels causes a considerable hassle:
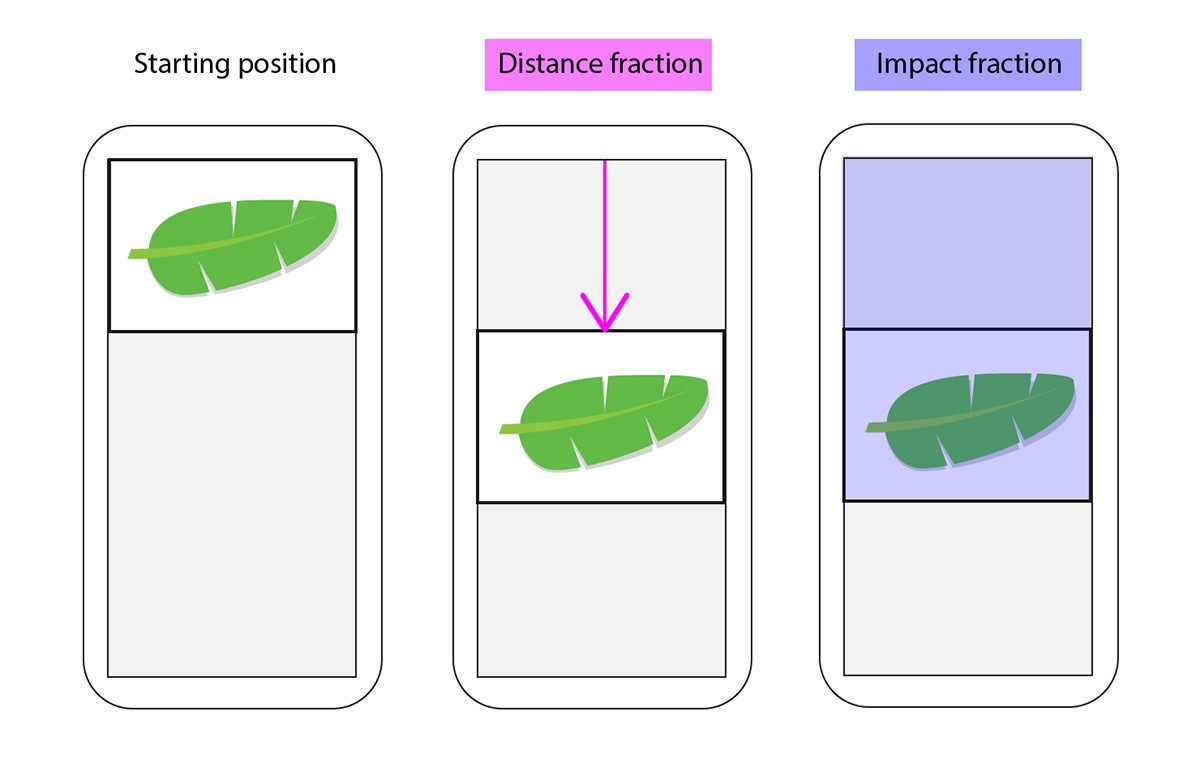
In the example above, the element moves down by ⅓ of the viewport height, so the distance fraction is 0.33.
The area that the element occupied in its starting position and the area it occupies after the move make up ⅔ of the viewport surface, so the impact fraction is 0.66.
layout shift score = distance fraction * impact fractionThe layout shift score is 0.33 × 0.66 = 0.2178.
The Cumulative Layout Shift score is the sum of scores from all of the unstable elements that move around during page load.
Lower CLS score is better because it means less content shifting occurred during page load.
If the element in the example above had moved by only 10% of the viewport, the distance fraction would be 0.1 and the impact fraction 0.4. The layout shift score would be only 0.1 × 0.4 = 0.04.
The ideal, but unrealistic, CLS score is 0. In reality, and Chrome Use Experience Report, any CLS score smaller than 5 is considered good. Different types of websites might move content purposefully and have high CLS scores that don’t indicate bad user experience. In any case, it’s useful to monitor CLS so you can catch any unexpected increases in the score and fix problematic layout instability issues.
CLS is already available in the Chrome User Experience Report, and you can measure CLS in JavaScript using the Layout Instability API. It will be introduced to Calibre and Lighthouse in the near future.
Boost your customer experience by tracking new web performance metrics#
Having a way to measure the nuances of user experience accurately makes it possible to quantify the impact it has on your bottom line. Automated performance monitoring is the key to tracking improvements and catching regressions. Calibre supports this new generation of metrics such as Largest Contentful Paint and Total Blocking Time. With the insights offered by these metrics, you can apply actionable guidance for solving the issues that users face and create great products.