

Lighthouse, the popular open source quality auditing suite, just released its eighth stable version. While the project is actively maintained and developed, this release comes with notable changes to the Performance Score. The Performance Score is a 0-100 grade that people often look up to as a holistic overview of how fast a site or application is. It’s also a helpful abstraction to communicate speed to managers and stakeholders who don’t work on web performance on a day-to-day basis.
This post describes what has changed between Lighthouse 7 and 8 and what you might notice in your site speed tracking.
How is Performance Score calculated in Lighthouse 8?#
In Lighthouse 8, there are no metric additions or removals in Performance Score calculation, but the importance of existing measurements changed. First Contentful Paint (FCP), Speed Index (SI) and Time to Interactive (TTI) all lost 5% in their weight. Two of Core Web Vitals, Total Blocking Time (plus 5%) and Cumulative Layout Shift (plus 10%), gained in importance.
| Metric | Lighthouse 6 + 7 weight | Lighthouse 8 weight |
|---|---|---|
| First Contentful Paint | 15% | 10% -5% |
| Speed Index | 15% | 10% -5% |
| Time to Interactive | 15% | 10% -5% |
| Largest Contentful Paint | 25% | 25% no change |
| Total Blocking Time | 25% | 30% +5% |
| Cumulative Layout Shift | 5% | 15% +10% |
In Lighthouse 8, Web Vitals account for 70% of the Performance Score calculation.
The change in weights for contributing metrics isn’t the only reason why Performance Score might differ in Lighthouse 8.
Cumulative Layout Shift is calculated with a new definition#
After numerous improvements to the visual stability metric, Cumulative Layout Shift is calculated using the new, windowed definition. This adjustment might not make a massive difference in the lab (synthetic) testing but will significantly impact the field (real user monitoring) reporting.
You can still observe changes in your scoring based on CLS alone since its importance increased significantly.
First Contentful Paint and Total Blocking Time score curves change#
The Performance Score calculation depends on individual metric weight and real-world HTTP Archive data to determine two control points of reference. Based on those points, your reading is categorised as “poor”, “needs improvement” or “good”. In Lighthouse 8, those reference points have been adjusted for FCP and TBT to be more strict, which means it might be harder to achieve optimal readings.
With the changes above, the Lighthouse team predicts the following shifts to Performance Score:
- ~20% of sites may see a drop of up to 5 points (though likely less)
- ~20% of sites will see little detectable change
- ~30% of sites should see a moderate improvement of a few points
- ~30% could see a significant improvement of 5 points or more
Should I track Performance Score or Web Vitals?#
Both. Performance Score can provide a helpful abstraction when tracking speed and communicating it outside of the team working on web performance. While Core Web Vitals are included in the score calculation, we should track them separately (both in lab and field settings) to ensure the best user experience.
Why are Core Web Vitals so important?#
Core Web Vitals are a set of reasonably new metrics that reflect different aspects of user experience. Over the last couple of years, Core Web Vitals have been developed and improved, and now they are used as page ranking signals for the Google search engine.
It’s a set of modern metrics that can accurately portray core aspects of what makes a good browsing experience; thus, they are emphasised both in the Performance Score and standalone metrics.
Where can I inspect how Performance Score is calculated?#
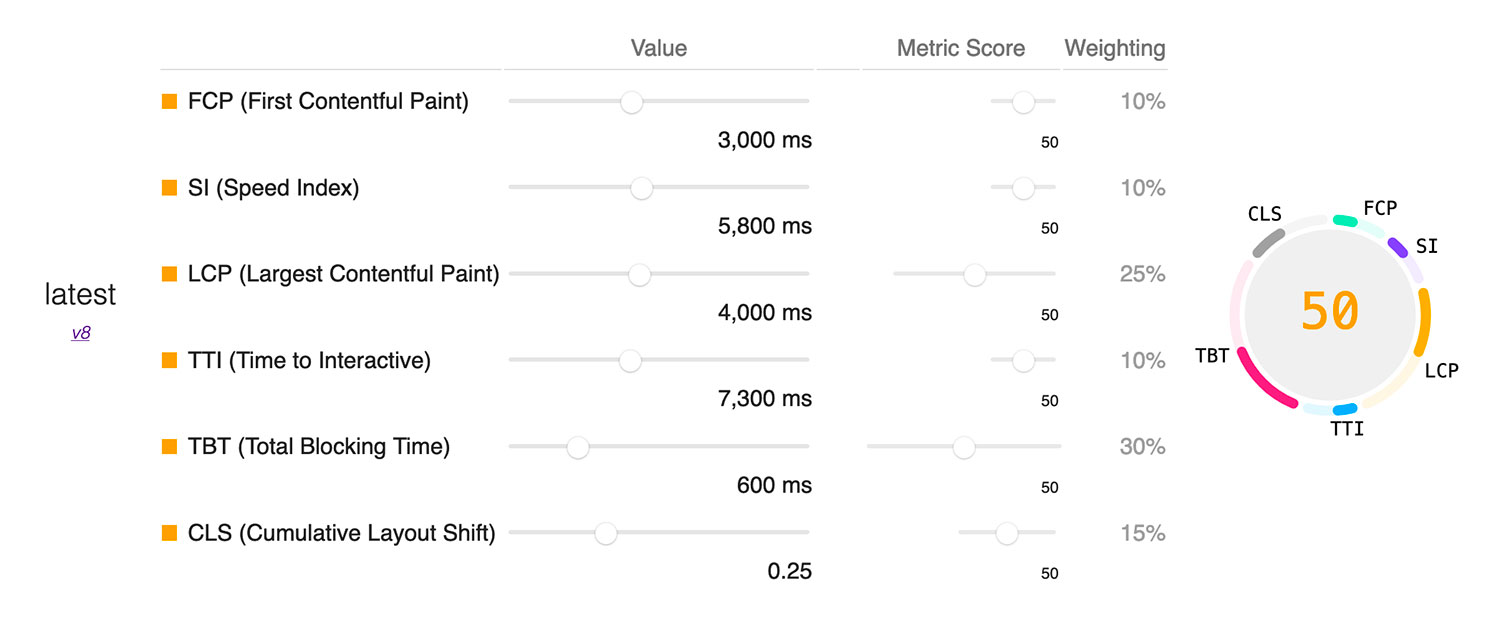
The Performance Score calculator is an excellent visualisation of how individual metrics contribute to the score. You can differentiate between desktop and mobile to see how grading changes. You can also inspect how you’d have to improve specific metrics to observe the most significant changes in the Performance Score (if that’s your goal).
How do I improve Cumulative Layout Shift?#
Cumulative Layout Shift focuses on portraying visual stability. Improvements that will make elements shift less (or not at all) to create a predictable experience will positively impact CLS. There are a handful of common reasons why Cumulative Layout Shift might not be good:
- Images, ads, iframes and embeds without specified dimensions
- Unoptimised webfont delivery and display
- Inefficient CSS animations
- Late-injected JavaScript content
Learn more about addressing common issues causing layout shifts in the Cumulative Layout Shift guide.
How do I improve Total Blocking Time?#
We use Total Blocking Time in lab (synthetic) monitoring as an alternative (but not equivalent) to Interaction to Next Paint. Total Blocking Time captures the impact of long JavaScript tasks on interactivity. While more JavaScript will generally cause web performance issues, not all script is equal in impact. Here are a few reasons why Total Blocking Time isn’t optimal:
- Significant main thread activity
- Considerable amount of unused code
- Large amount of JavaScript requests and file size
- Unoptimised third party script
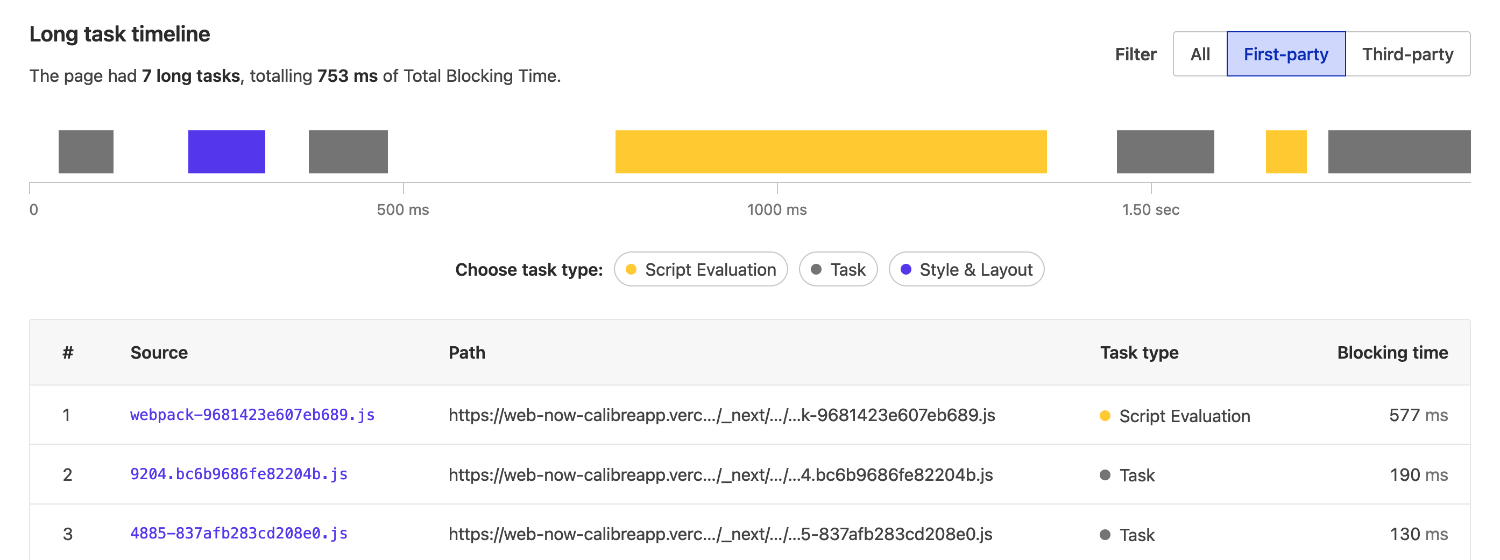
You can visualise long tasks on the Long Task Timeline in Calibre to identify and address problematic scripts.
While the changes above are essential to be aware of, it’s also critical to remember that Performance Score alone doesn’t paint a complete picture of web performance. When focusing on speed, make sure to track a wide variety of metrics.
If you are curious about more details on Lighthouse 8 release, read the full changelog and frequently asked questions covering motivations for the changes.