

There is no site speed optimisation without accurate data and metrics to base it on. However, what counts as "accurate" and how that data gets collected is a more complicated topic than you might expect.
One of the most popular ways to measure accurate website performance metrics is with synthetic monitoring. Instead of basing data points on actual real visitors, synthetic monitoring uses an automated browser to replicate a visit and record crucial data points like Core Web Vitals.
Synthetic monitoring isn't perfect. However, it has some unique advantages that lend themselves to effective site speed optimisation techniques—especially if you know what you’re doing. Once you know what synthetic monitoring is and how to get more out of it, you can maximise its potential to create an even faster website.
What is synthetic monitoring?#
Synthetic monitoring is a method for testing and measuring website performance that uses an automated client to approximate your visitors. You can mimic different visitor locations, internet connection speeds, device types, and internet preferences using synthetic monitoring systems, like whether they have an ad blocker enabled.
By mimicking these specific elements, you get data that reflects the conditions your actual visitors will be under when they access your site. Since this data is based on scheduled tests and not actual visitors, you’re free to run these tests as often as you'd like, even before a change goes live. This way, it’s possible to proactively improve site performance for all kinds of visitors to your site regardless of who they are, how they access it, and where they're located.
How does synthetic monitoring work?#
Synthetic monitoring works by continually crawling your websites or apps using a machine calibrated with predefined settings. Since these settings and the testing cadence remain constant, the results give you a stable baseline to gauge web performance.
Every time a test is scheduled to run, the computer will automatically attempt to access the web page or pages you’re testing. As the page loads, it'll record key metrics about the loading process, like server response time, Total Blocking Time (TBT), or Cumulative Layout Shift (CLS). It then reports those results to the system so you can access and act on that information.
It's not rare for servers or individual web pages to experience drops. If synthetic monitors test during one of these drops, they’ll recognise that the test results fall outside normal ranges and retest to verify if there’s a real issue.
You can also configure synthetic monitoring tools for different scenarios based on the needs of your team. For instance, you can test from different server locations, throttle the internet speed, or mimic different devices. This way, you receive data more reflective of how your visitors are most likely to interact with your website.
Synthetic monitoring vs. real user monitoring#
Instead of using machines to replicate and monitor site performance as synthetic monitoring does, real user monitoring (RUM) collects data from actual visitors to your site. The most common example of RUM is Google Analytics, which passively tracks your visitors with a script to provide you with data on their experience.
Both synthetic and real user monitoring have their advantages, and, generally, you should be using a mix of the two to get the best of both worlds. For instance, synthetic monitoring allows you to test performance even when there is very little or no traffic to those pages. However, synthetic relies heavily on machines and algorithms, so it’s good to reinforce what you learn with RUM data to make sure you’re getting an accurate picture of your site performance.
The benefits of synthetic monitoring#
It's tempting to assume that it’s superior to synthetic monitoring because real user monitoring data comes directly from site visitors. The truth, however, is more complicated. Here are just a few reasons why synthetic monitoring deserves a place in your web performance toolkit:
- Test before release: Fix any issues proactively before they affect people on your site. Synthetic monitoring allows you to test a page early, so it’s perfect right from launch.
- Stable testing environment: Benchmark your tests confidently. As you know, every test was done under identical circumstances.
- Validate experiments quickly: Test new things on your site and see how they affect performance without waiting for visitors to try them out.
- Test multiple devices and locations: Verify how your site handles visitors from multiple places across the world on different devices.
How to take advantage of synthetic monitoring#
Once you have access to a synthetic monitoring tool, it’s essential you know how to use it to get the best possible results. It's easy to set a single daily test across your entire domain and forget about it. If you want to start using this tool to improve your site speed, here are some tips to get you started.
Test often and consistently#
The key to good synthetic monitoring data is to have lots of consistent data points that'll help you to spot trends and aberrations early. If you’re only testing sporadically, getting a good idea of how recent optimisations or updates have affected your key performance metrics will be challenging.
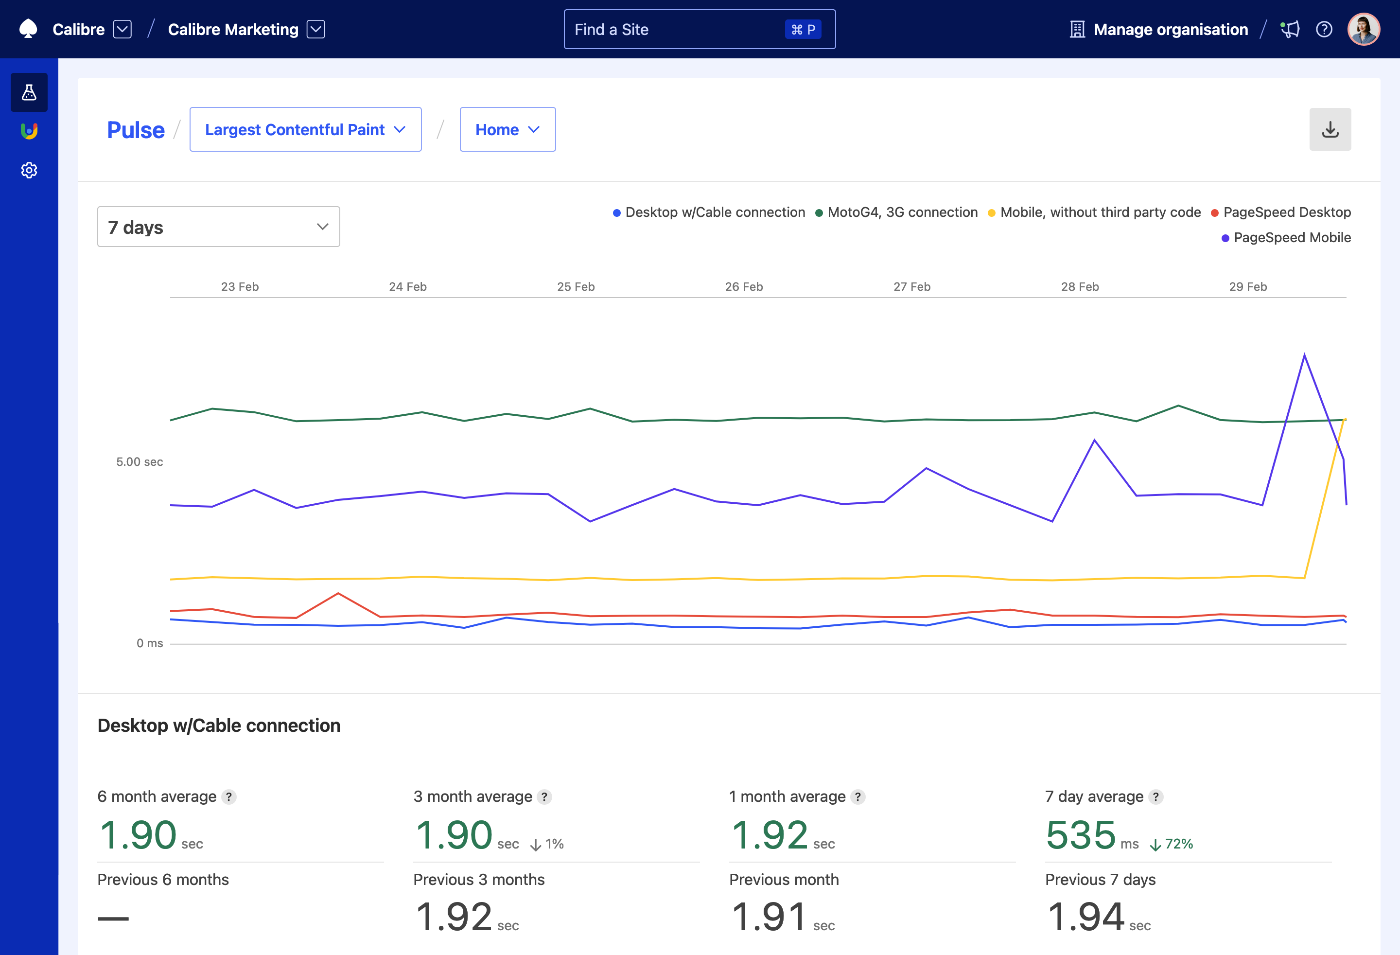
Testing frequently also helps you catch site speed issues. If an error or outage has affected one of your pages, synthetic monitoring will pick up on it and alert you to its presence. The best practice is to test your pages at least once daily so you don’t miss any outages or unexpected slowdowns.
Use multiple variables#
It's best to run synthetic tests with multiple variables to emulate your target audience better. Calibre’s Test Profiles include options to customise network speed, device type, location, and whether JavaScript is blocked or not.
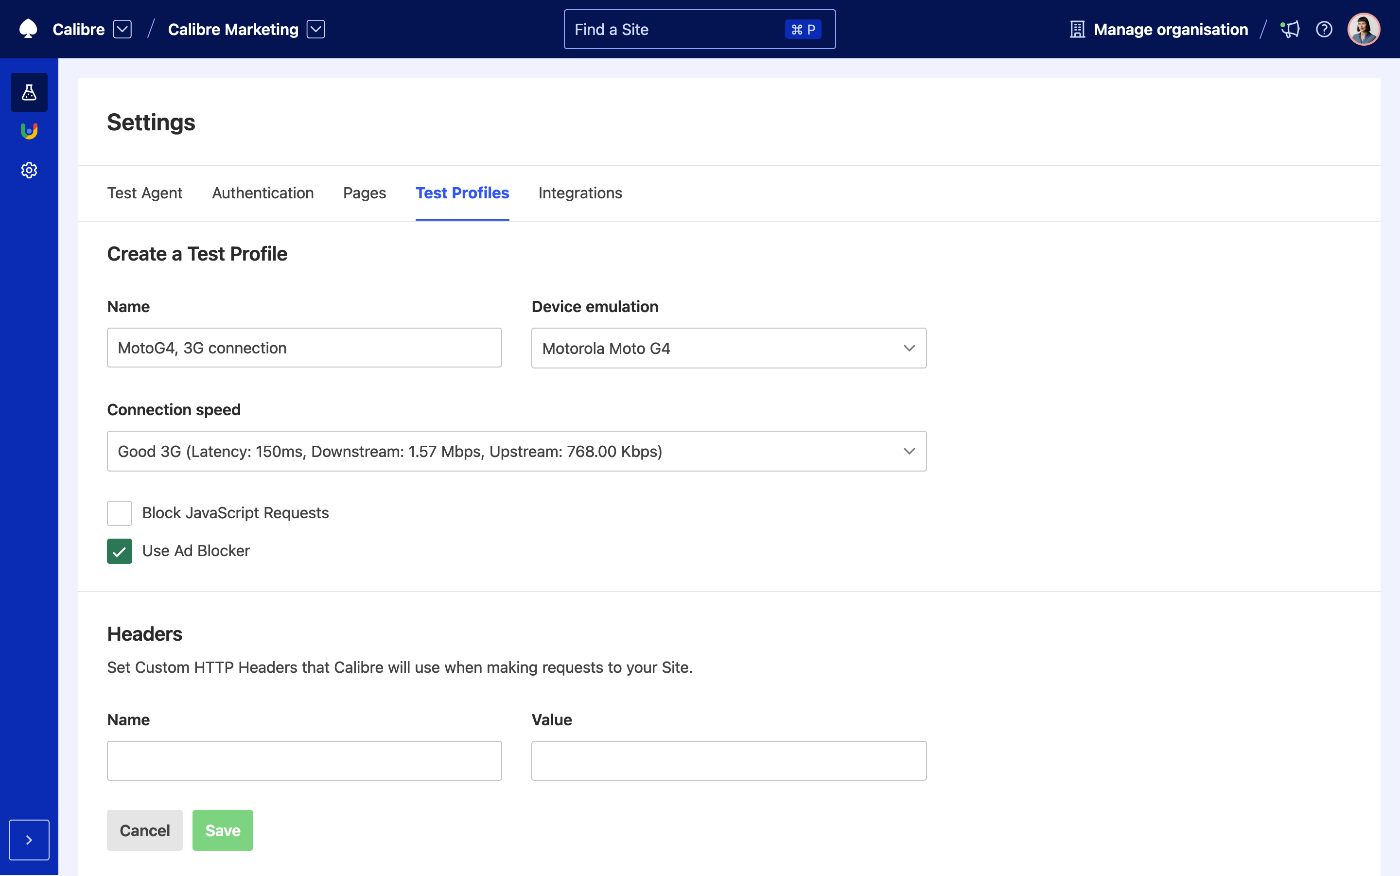
You'll see how your website performs under various conditions by testing it multiple times with different profiles. If you only test with one default setting, you might not see that your website is prohibitively slow for visitors from different parts of the world or with various devices or connection speeds. Once you know how your website performs under multiple conditions, you can make changes to ensure it works well regardless of how your visitors are accessing your site.
Set performance budgets#
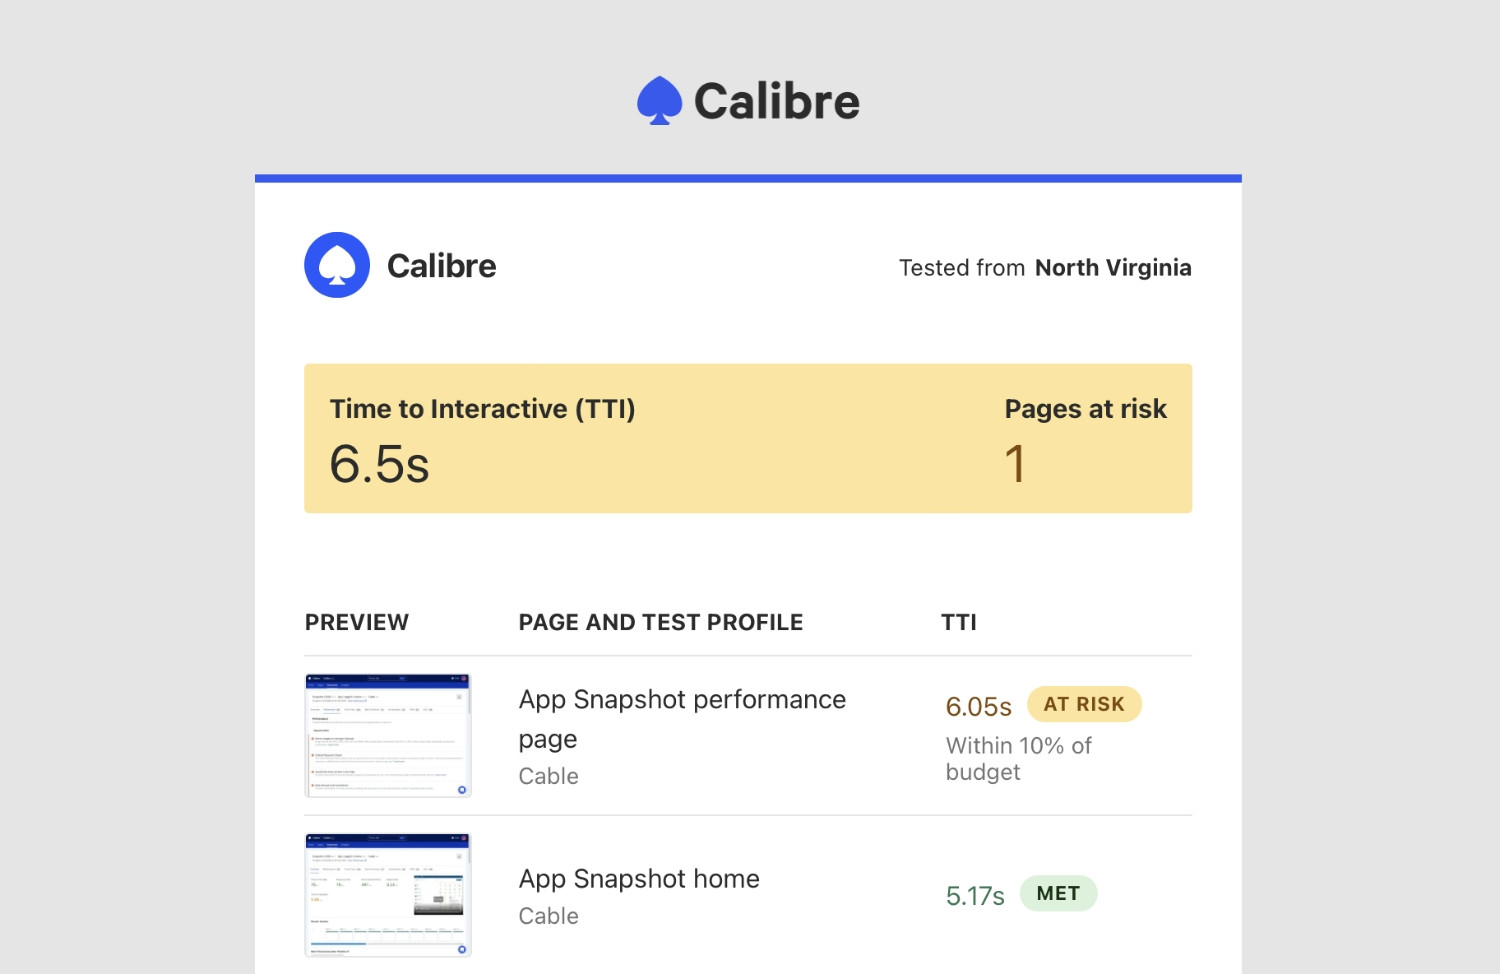
Performance budgets are defined as limits you and your team set around acceptable page speed metrics. For instance, you could decide that your pages must have a Largest Contentful Paint (LCP) score of no more than 2.5 seconds. Any pages that exceed that threshold would be flagged so you can work on them and bring them within your performance budget.
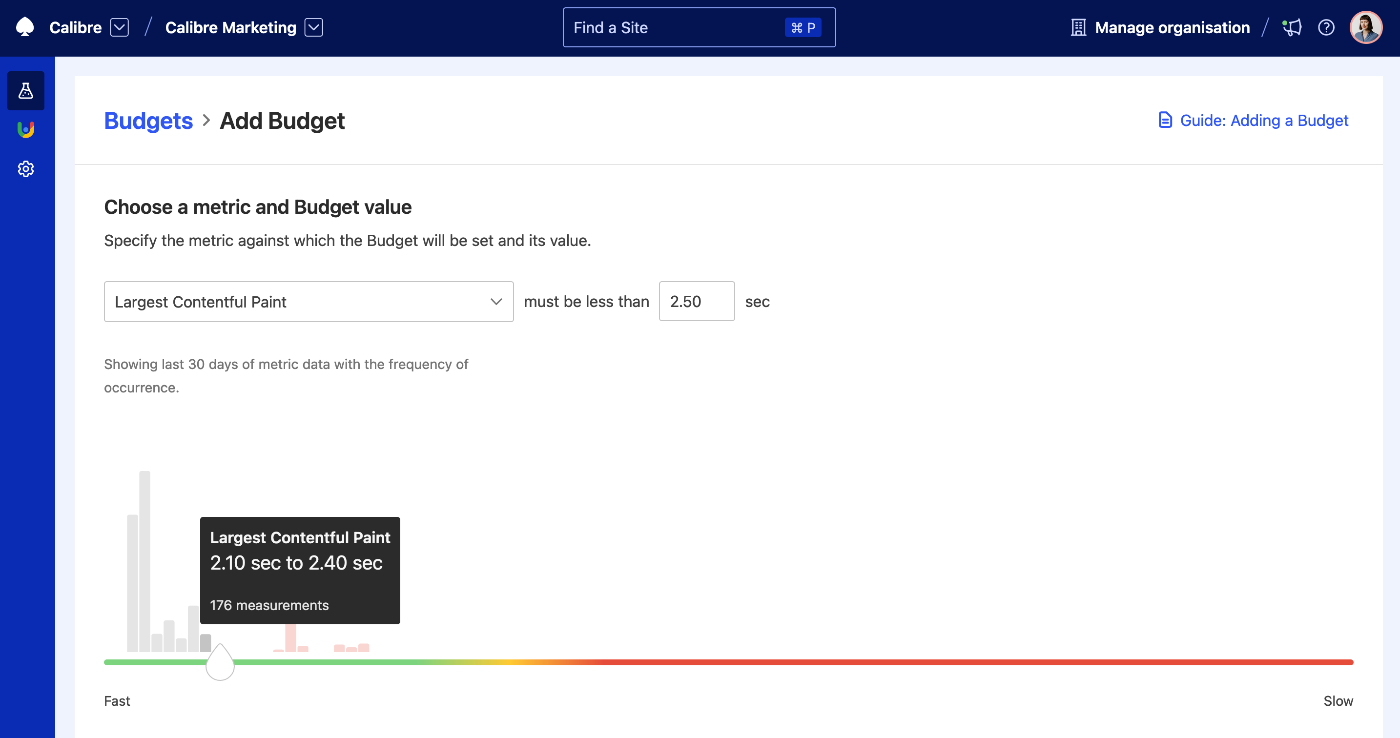
Setting performance budgets helps you stay honest with your site speed. It's easier to flag areas where you’re too slow when you have concrete limits to base decisions on. They also help provide a target for your team to hit. Start a Speed Team, and then use performance budgets as your guides so everyone can see how their efforts contribute to better site performance.
Connect to pull requests#
Pull Request Reviews allow your developers to test new changes and updates to your site before they go live, so you'll find issues before they affect user experience. It also frees up your developers to experiment more, as they can easily test multiple deployments to see how changes they make directly impact site performance.
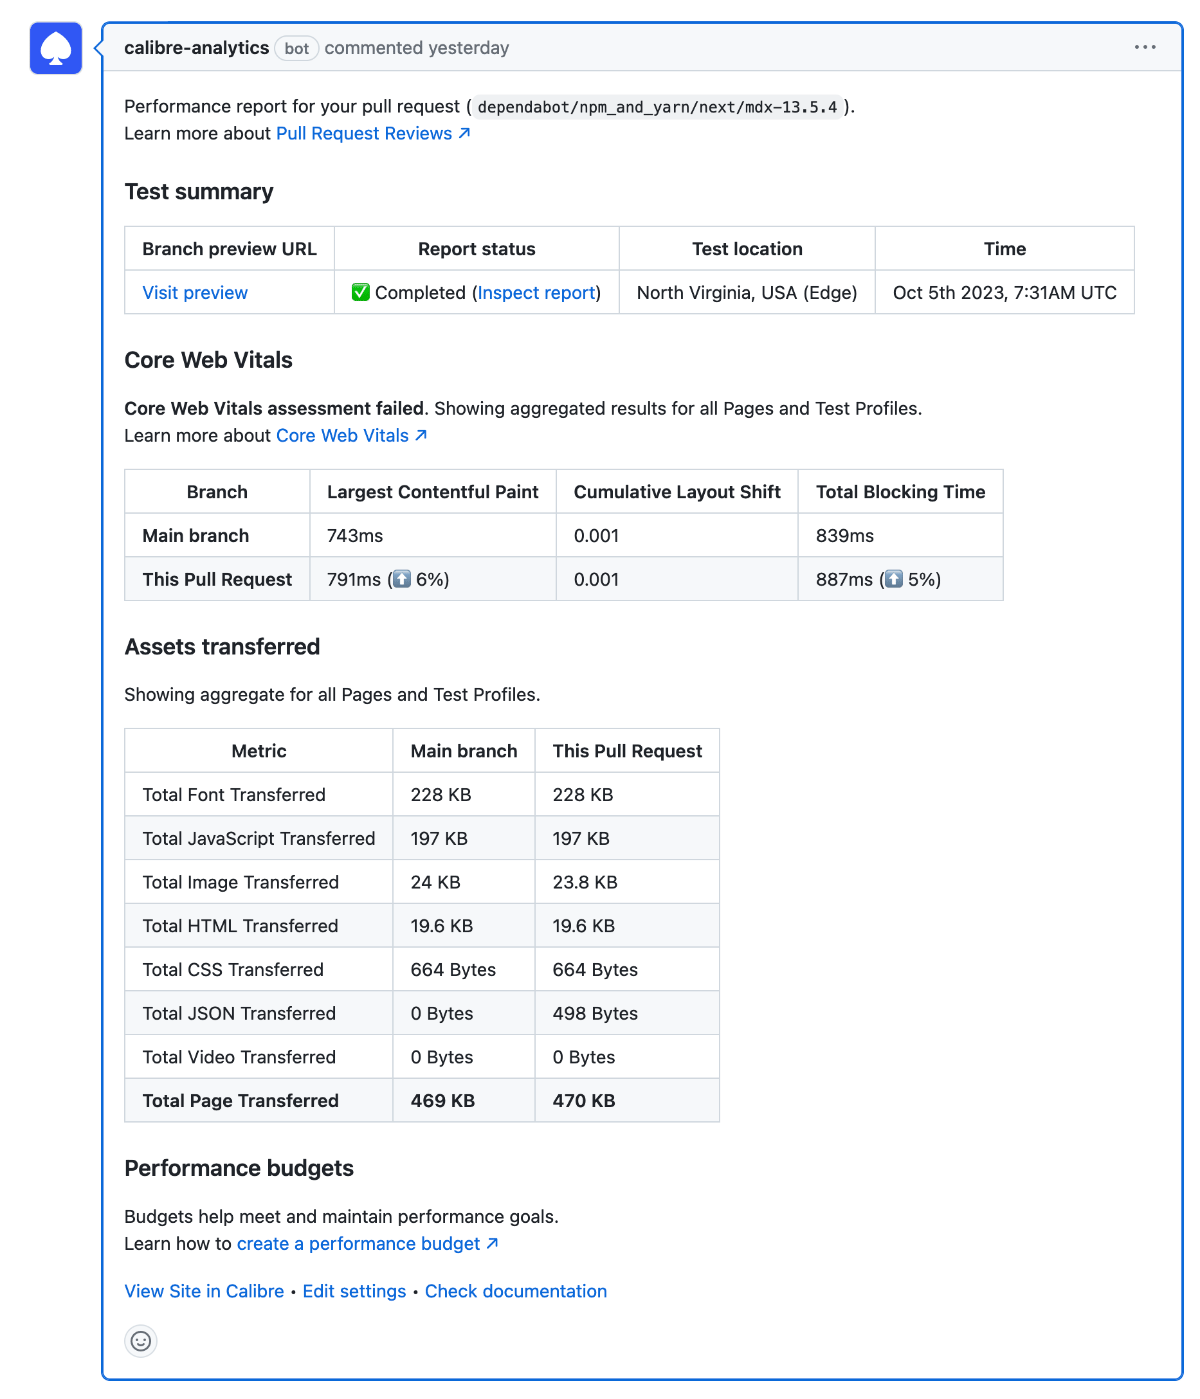
Further, since Calibre integrates with GitHub, you can see when updates are deployed on a timeline. This way, it’s obvious if a recent deployment is a culprit for recent site speed problems.
Configure alerts#
Alerts help you and your team stay on top of urgent speed issues affecting your site. Your website could experience an outage or slowdown at any moment, and you don’t want those issues to go unaddressed for too long. An alert is a simple way to find out about site issues before you hear them from site visitors.
When configuring your alerts, think about:
- Who needs to receive the alerts?
- What issues deserve urgent alerts?
- What system is in place to receive and handle these alerts?
Learn how to improve your site performance#
Getting the right tools to collect and display speed data is only half the battle. Once you know how your website is performing, you need to know how to act on those results to create a better experience for your visitors.
If you’re not sure where to start, consider some of these resources for further reading: