

People expect exceptional performance when they access your site. They want quick load times, stable layouts and quick interactivity, regardless of whether they’re on desktop or mobile. To meet those expectations, you’ll need to track website performance metrics that’ll give you quick and accurate insights into how your pages perform.
However, there are a near-limitless number of ways you could try to measure web performance, and some are far better than others. These 7 website performance metrics allow you to understand how your web page performs across several different page load aspects. Some focus solely on speed and others on interactivity, but all contribute to genuinely painting an image of how healthy your pages are. By tracking these 7 metrics, you give yourself all the data you need to provide a world-class online experience that meets or exceeds your visitors’ expectations.
Largest Contentful Paint (LCP)#
Largest Contentful Paint measures the size of the largest, above-the-fold element on a page when it loads. Usually, your LCP element is a large image, text or video file.
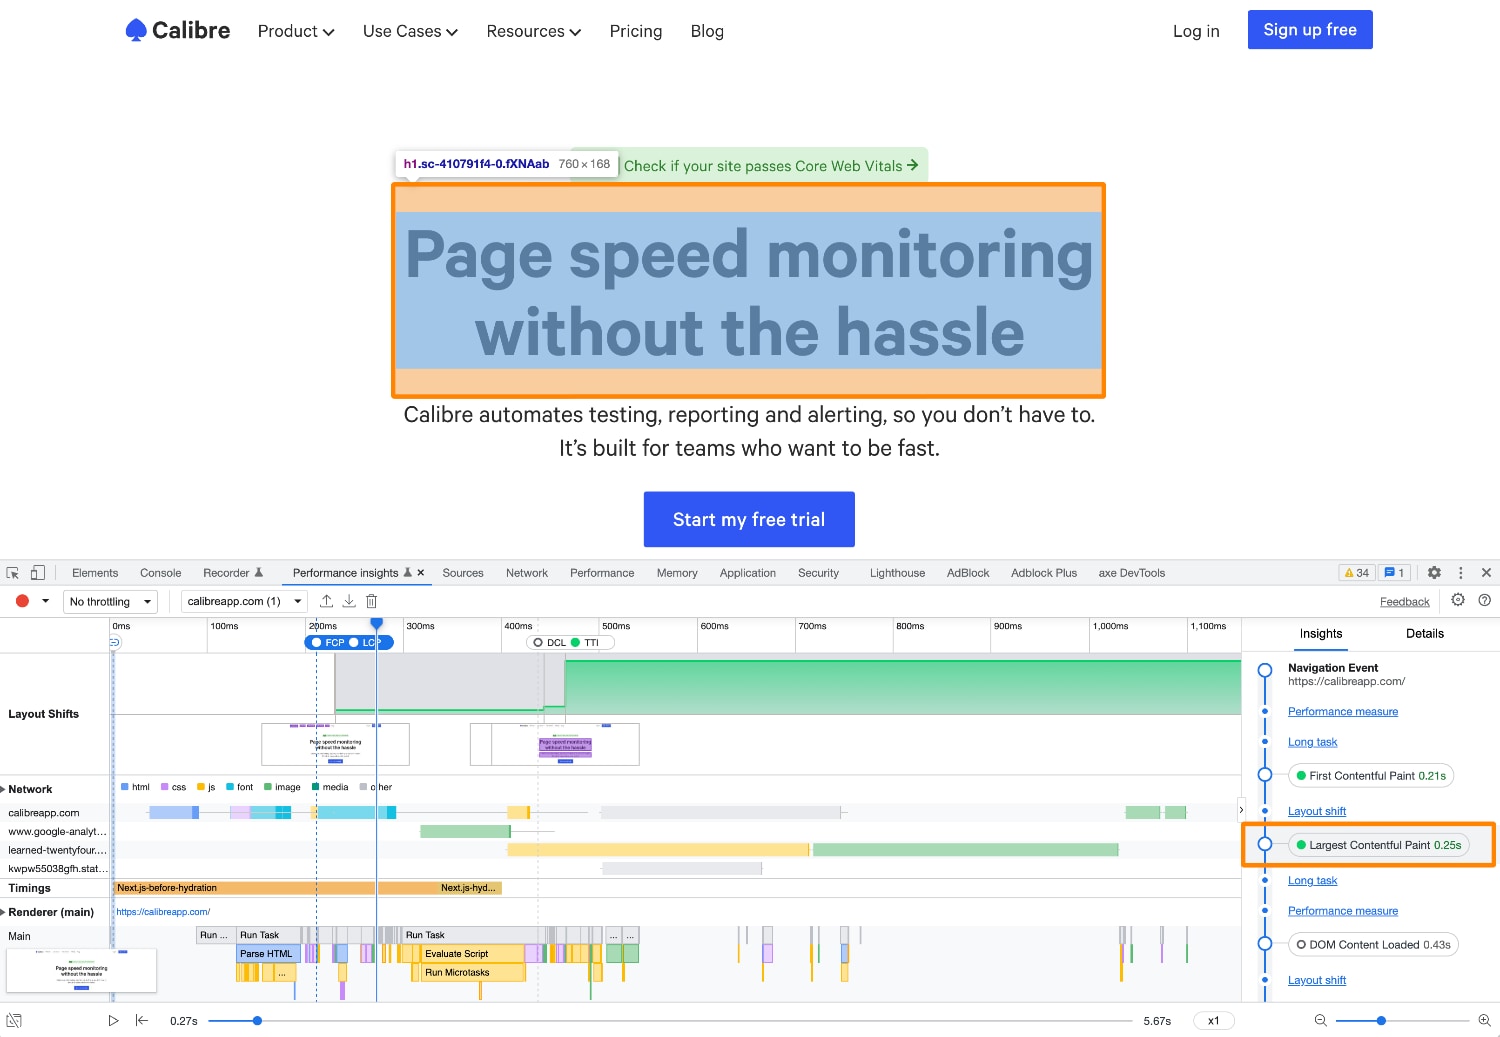
Why you should track LCP#
A substantial LCP element will negatively influence people’s perception of how fast your page is loading. The slower the main content loads, the more frustrating it is for visitors.
How to reduce LCP#
- Identify and reduce the file size of your LCP element.
- Improve your TTFB metric.
- Optimise your page load priorities.
Learn more about improving your LCP in our guide to Largest Contentful Paint.
Cumulative Layout Shift (CLS)#
Cumulative Layout Shift measures how much visual elements move around on your page. For every element shift, a score is determined based on how much it moves and how large it is. Your final CLS is a sum of all these scores after your page has had 5 consecutive seconds with no shifting.
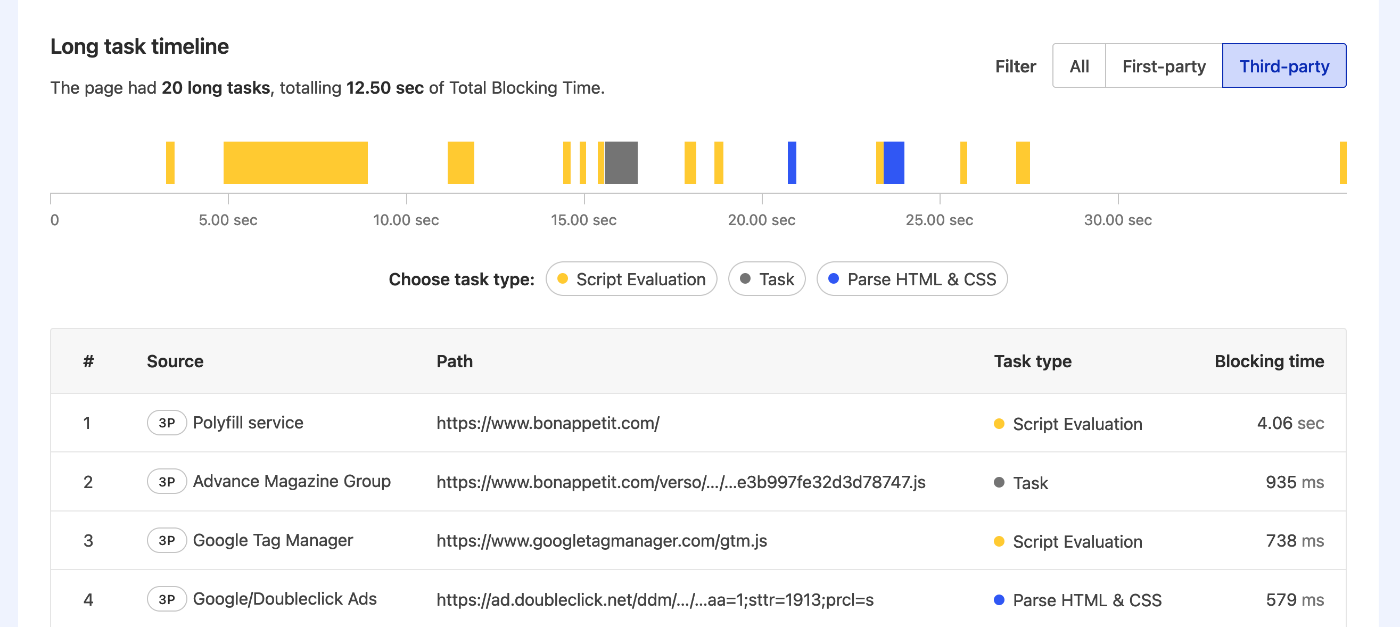
Why you should track TBT#
Visitors who interact with your site won’t perceive delays of less than 50 ms. If you keep all your tasks under this mark, your site will feel snappy and responsive, even while loading. The opposite is true, as well. If your TBT score is high, your page will feel sluggish to visitors, as their interactions take too long to process.
How to reduce TBT#
- Split, delay or optimise large tasks.
- Delay or remove non-critical third-party scripts.
- Reduce layout thrashing.
Learn more about improving TBT in our guide to Total Blocking Time.
Interaction to Next Paint (INP)#
Interaction to Next Paint measures the longest time a visitor needs to wait between when they interact with your page and when they get a response.
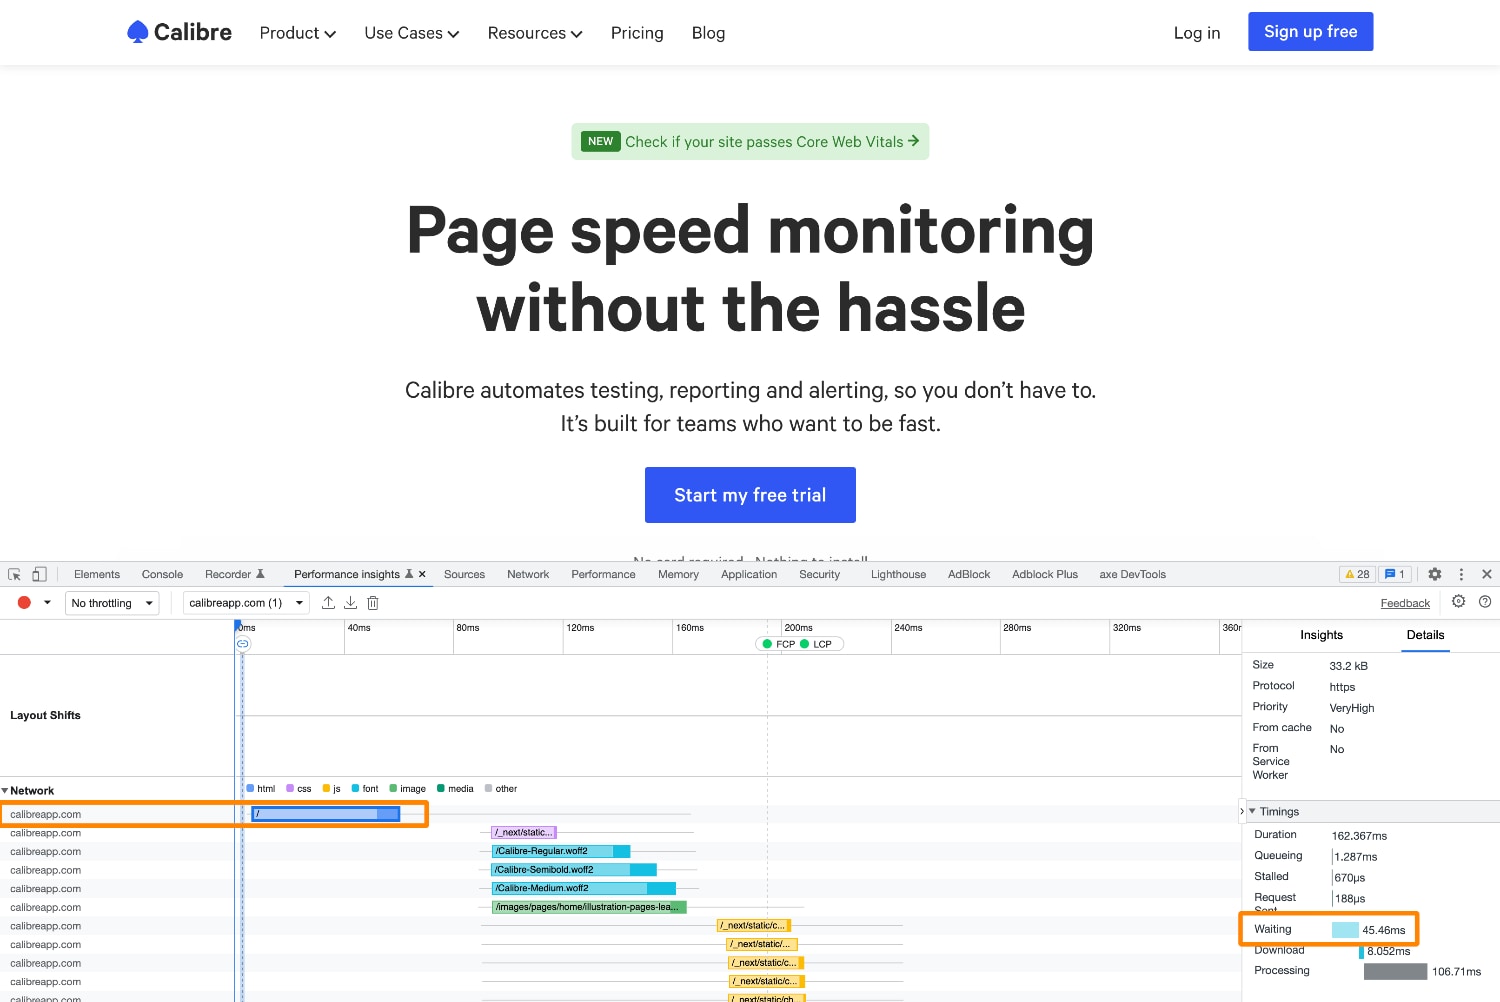
Why you should track TTFB#
TTFB is a great way to measure the effectiveness of your hosting and CDN choices. Poor TTFB (more than 300 ms) will delay the rendering of your page and affect other metrics. It also indicates that you might need a more effective hosting plan with servers closer to your visitors.
How to reduce TTFB#
- Upgrade your hosting or CDN.
- Implement server-side rendering.
- Check your cache-control headers.
Learn more about improving TTFB in our guide on Time to First Byte.
Number of Third-Party Scripts#
Third-party scripts are code and tooling from other companies that add extra functionality to your site. Common examples of third-party scripts are Google Ads, analytics tracking code and map widgets.
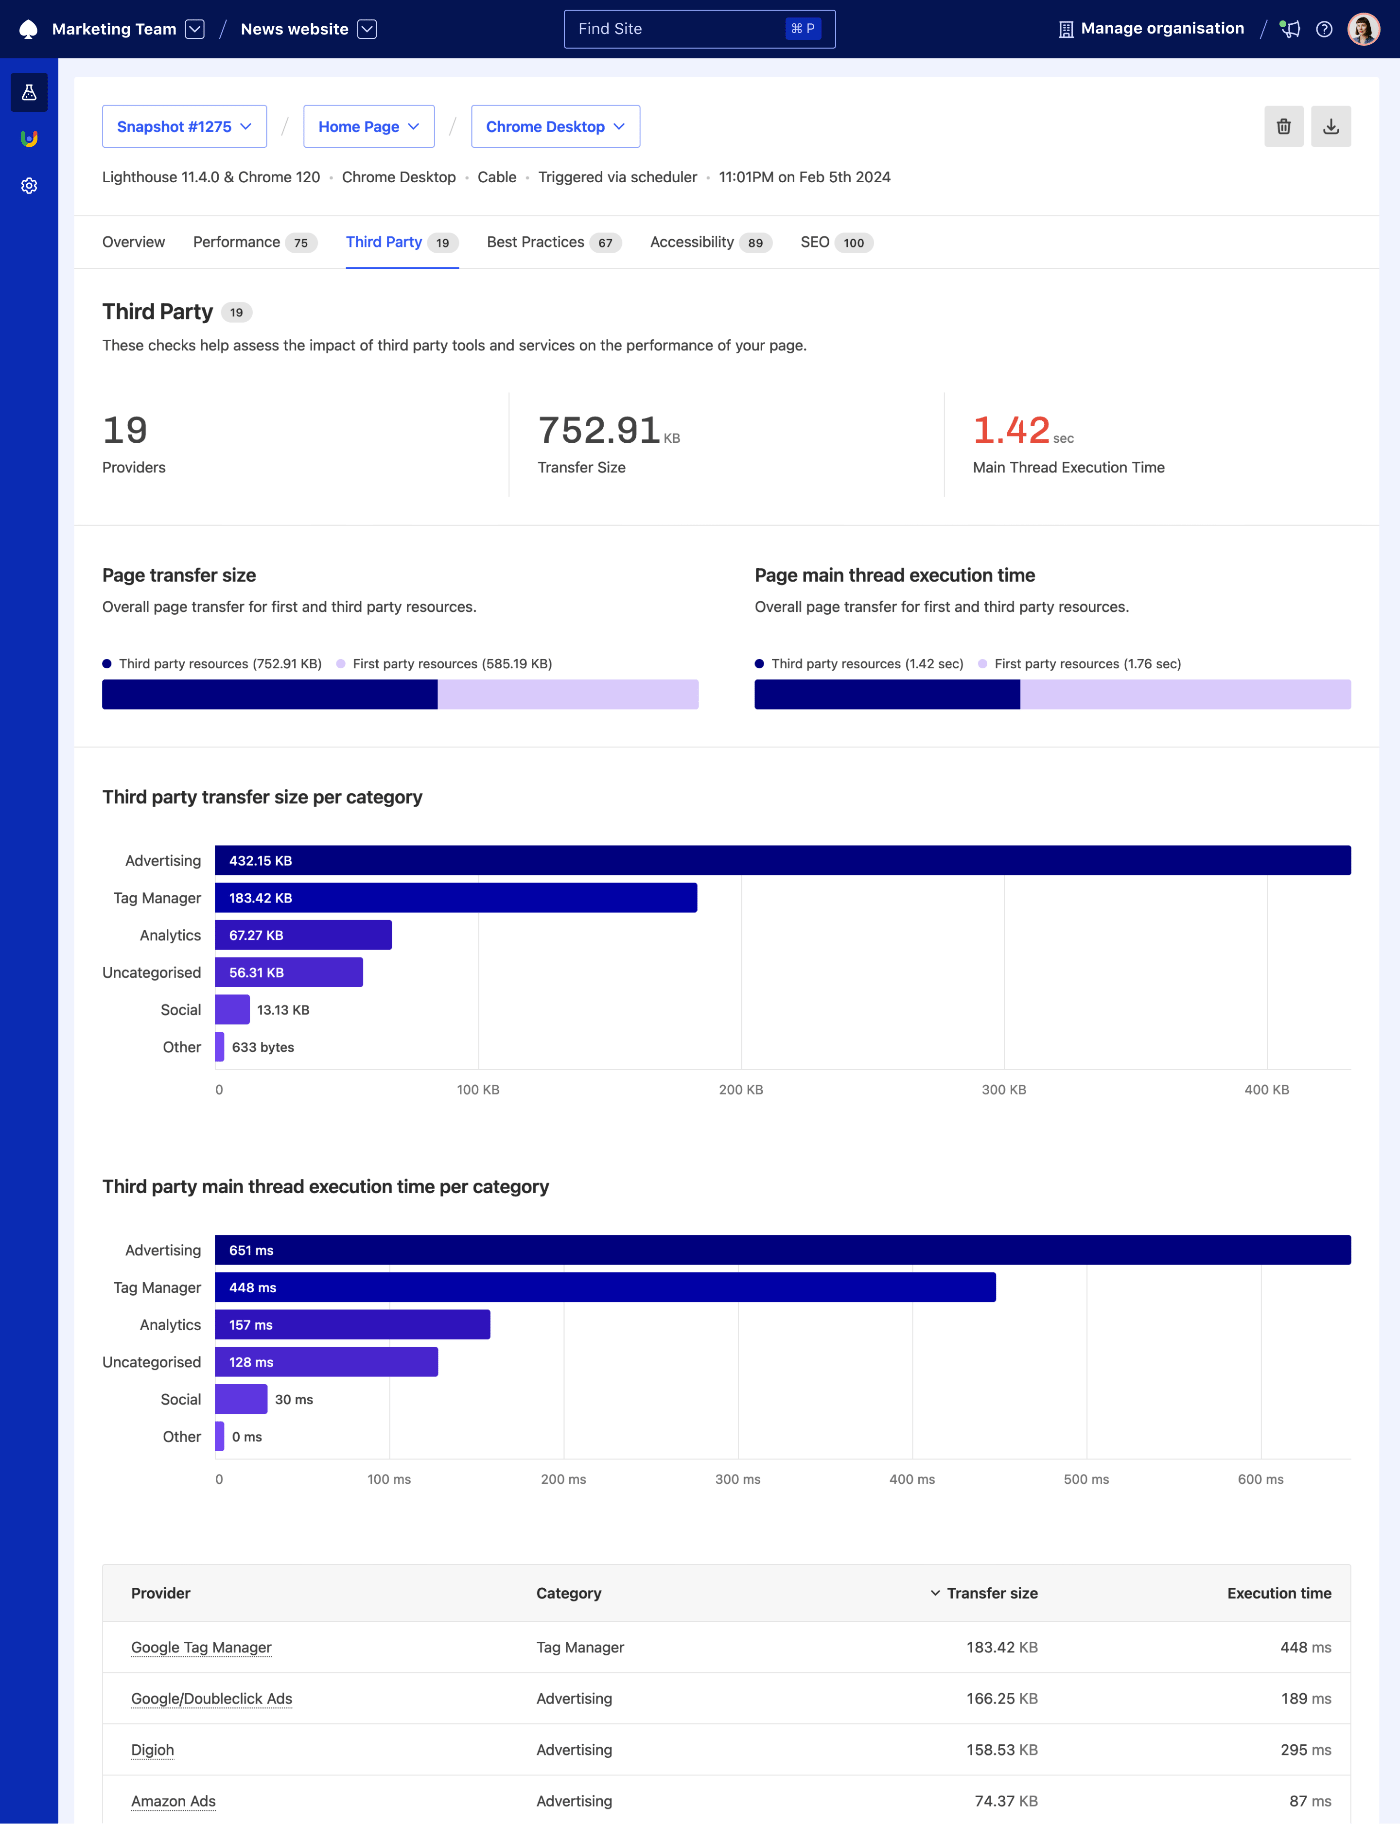
Why you should track third-party scripts#
Each third-party script you include adds more for that page to load. Although many third-party scripts are important for page functionality, it’s easy for pages to get bogged down with dozens of third parties inadvertently. Tracking your page’s third parties lets you be conscious of how many you’ve added so you can cut back if needed.
How to reduce the number of third-party scripts#
- Get rid of any unneeded third-party scripts.
- Educate your colleagues on the effect of third parties on web performance.
- Find lighter-weight alternatives for crucial third parties.
Learn more about identifying and managing third-party scripts.
Time to Interactive (TTI)#
Time to Interactive measures how long it takes for your web page to be fully interactive for your visitors. A page is considered fully interactive after the First Contentful Paint is done and the main thread has been free of long tasks (more than 50 ms) for at least 5 seconds.
Why you should track TTI#
Often, web performance focuses on making a page visually complete before it’s interactive for visitors. When visitors can see but not interact with a page, it leads to frustration. We should optimise pages for low TTI to ensure the best possible user experience.
How to reduce TTI#
- Find and optimise long tasks that block your main thread.
- Remove render-blocking resources from the page.
- Optimise your JavaScript.
Learn more about improving TTI in our guide to Time to Interactive.
Bonus: Commonly tracked metrics you should avoid#
Too much data can be just as harmful as not enough. For that reason, you need to ensure you’re only tracking the best possible website performance metrics. These three metrics are often tracked but should be avoided.
- First Meaningful Paint: FMP FMP produced unreliable results and was never standardised across browsers. If you’d like to track the most critical paints for your site, opt-in for FCP and LCP.
- Performance Score: The Lighthouse Performance Score attempts to give each page a single score out of 100 based on several important metrics. PS is ultimately a vanity metric, as it’s impossible to know where you need to improve in any of the categories it considers. Instead, track the above metrics, including many of the underlying metrics on which PS is built on.
Learn how to take action with your website performance metrics#
Getting the data you need is only the first step when you’re trying to improve your Core Web Vitals and web performance. After getting this data, you need to know how to implement it across your website and company for the best possible results.
These resources will help you take that next step toward a better web experience for your visitors:
- Check If Your Site Passes Core Web Vitals Assessment: See how well your pages are doing with some of the key metrics outlined above.
- Performance Budgets: The Easiest Way to a Faster Site: Learn how to set goals that’ll help you keep yourself accountable and achieve better performance.
- How to Convince Your Boss to Care About Speed: Better sites require buy-in from everyone, your bosses included.