When you’re tasked with monitoring performance for numerous websites, it can be challenging to keep up-to-date with the status of each one. It’s even harder to know when to take action.
Because of this, it’s easy to be unaware of performance issues until they become critical. Gathering data can be time-consuming and often requires manual effort.
Today, we’re excited to announce Team Insights, a new monthly high-level report that provides an easy-to-read summary of all Sites tracked in each team workspace.
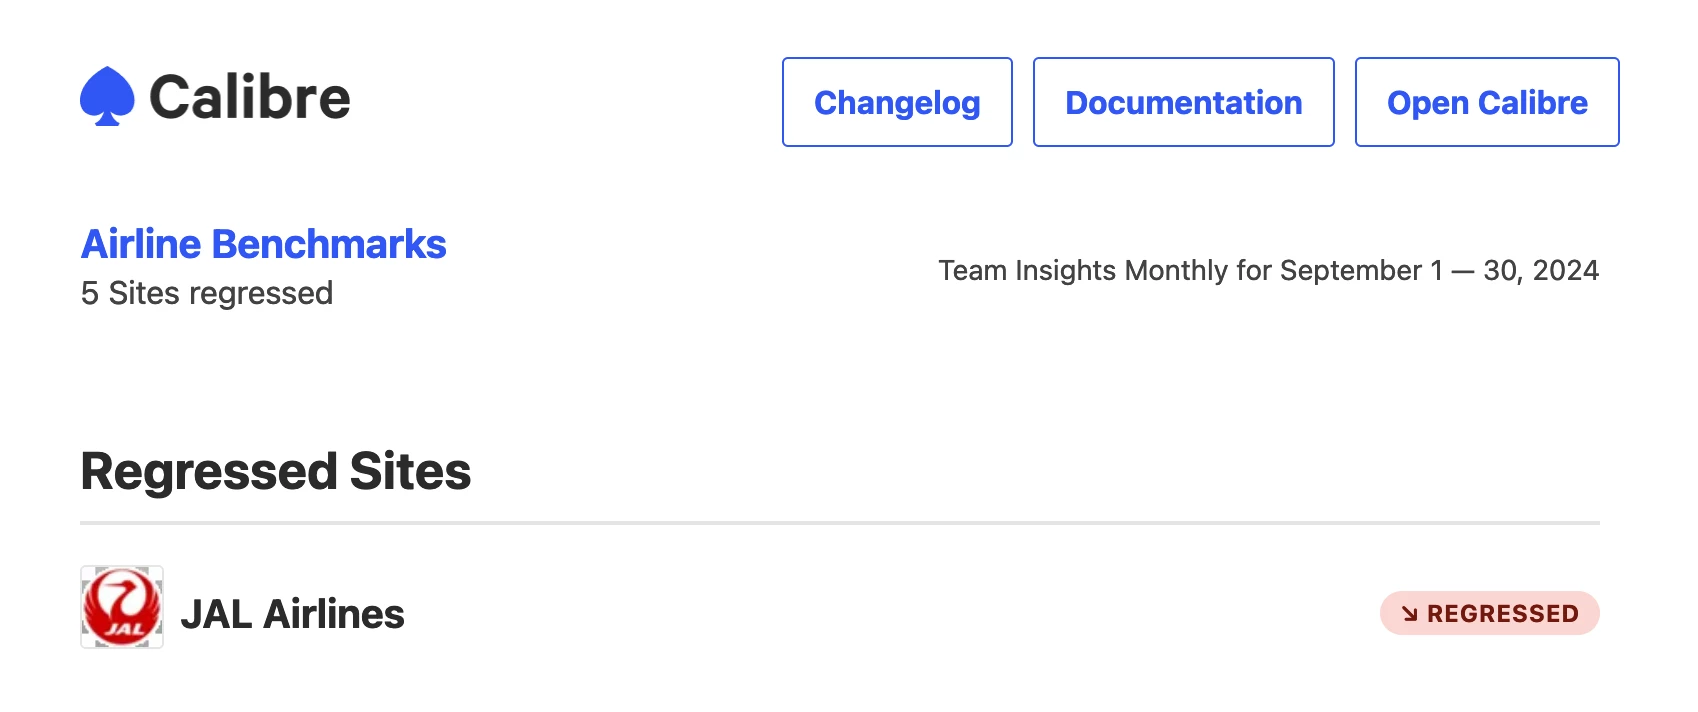
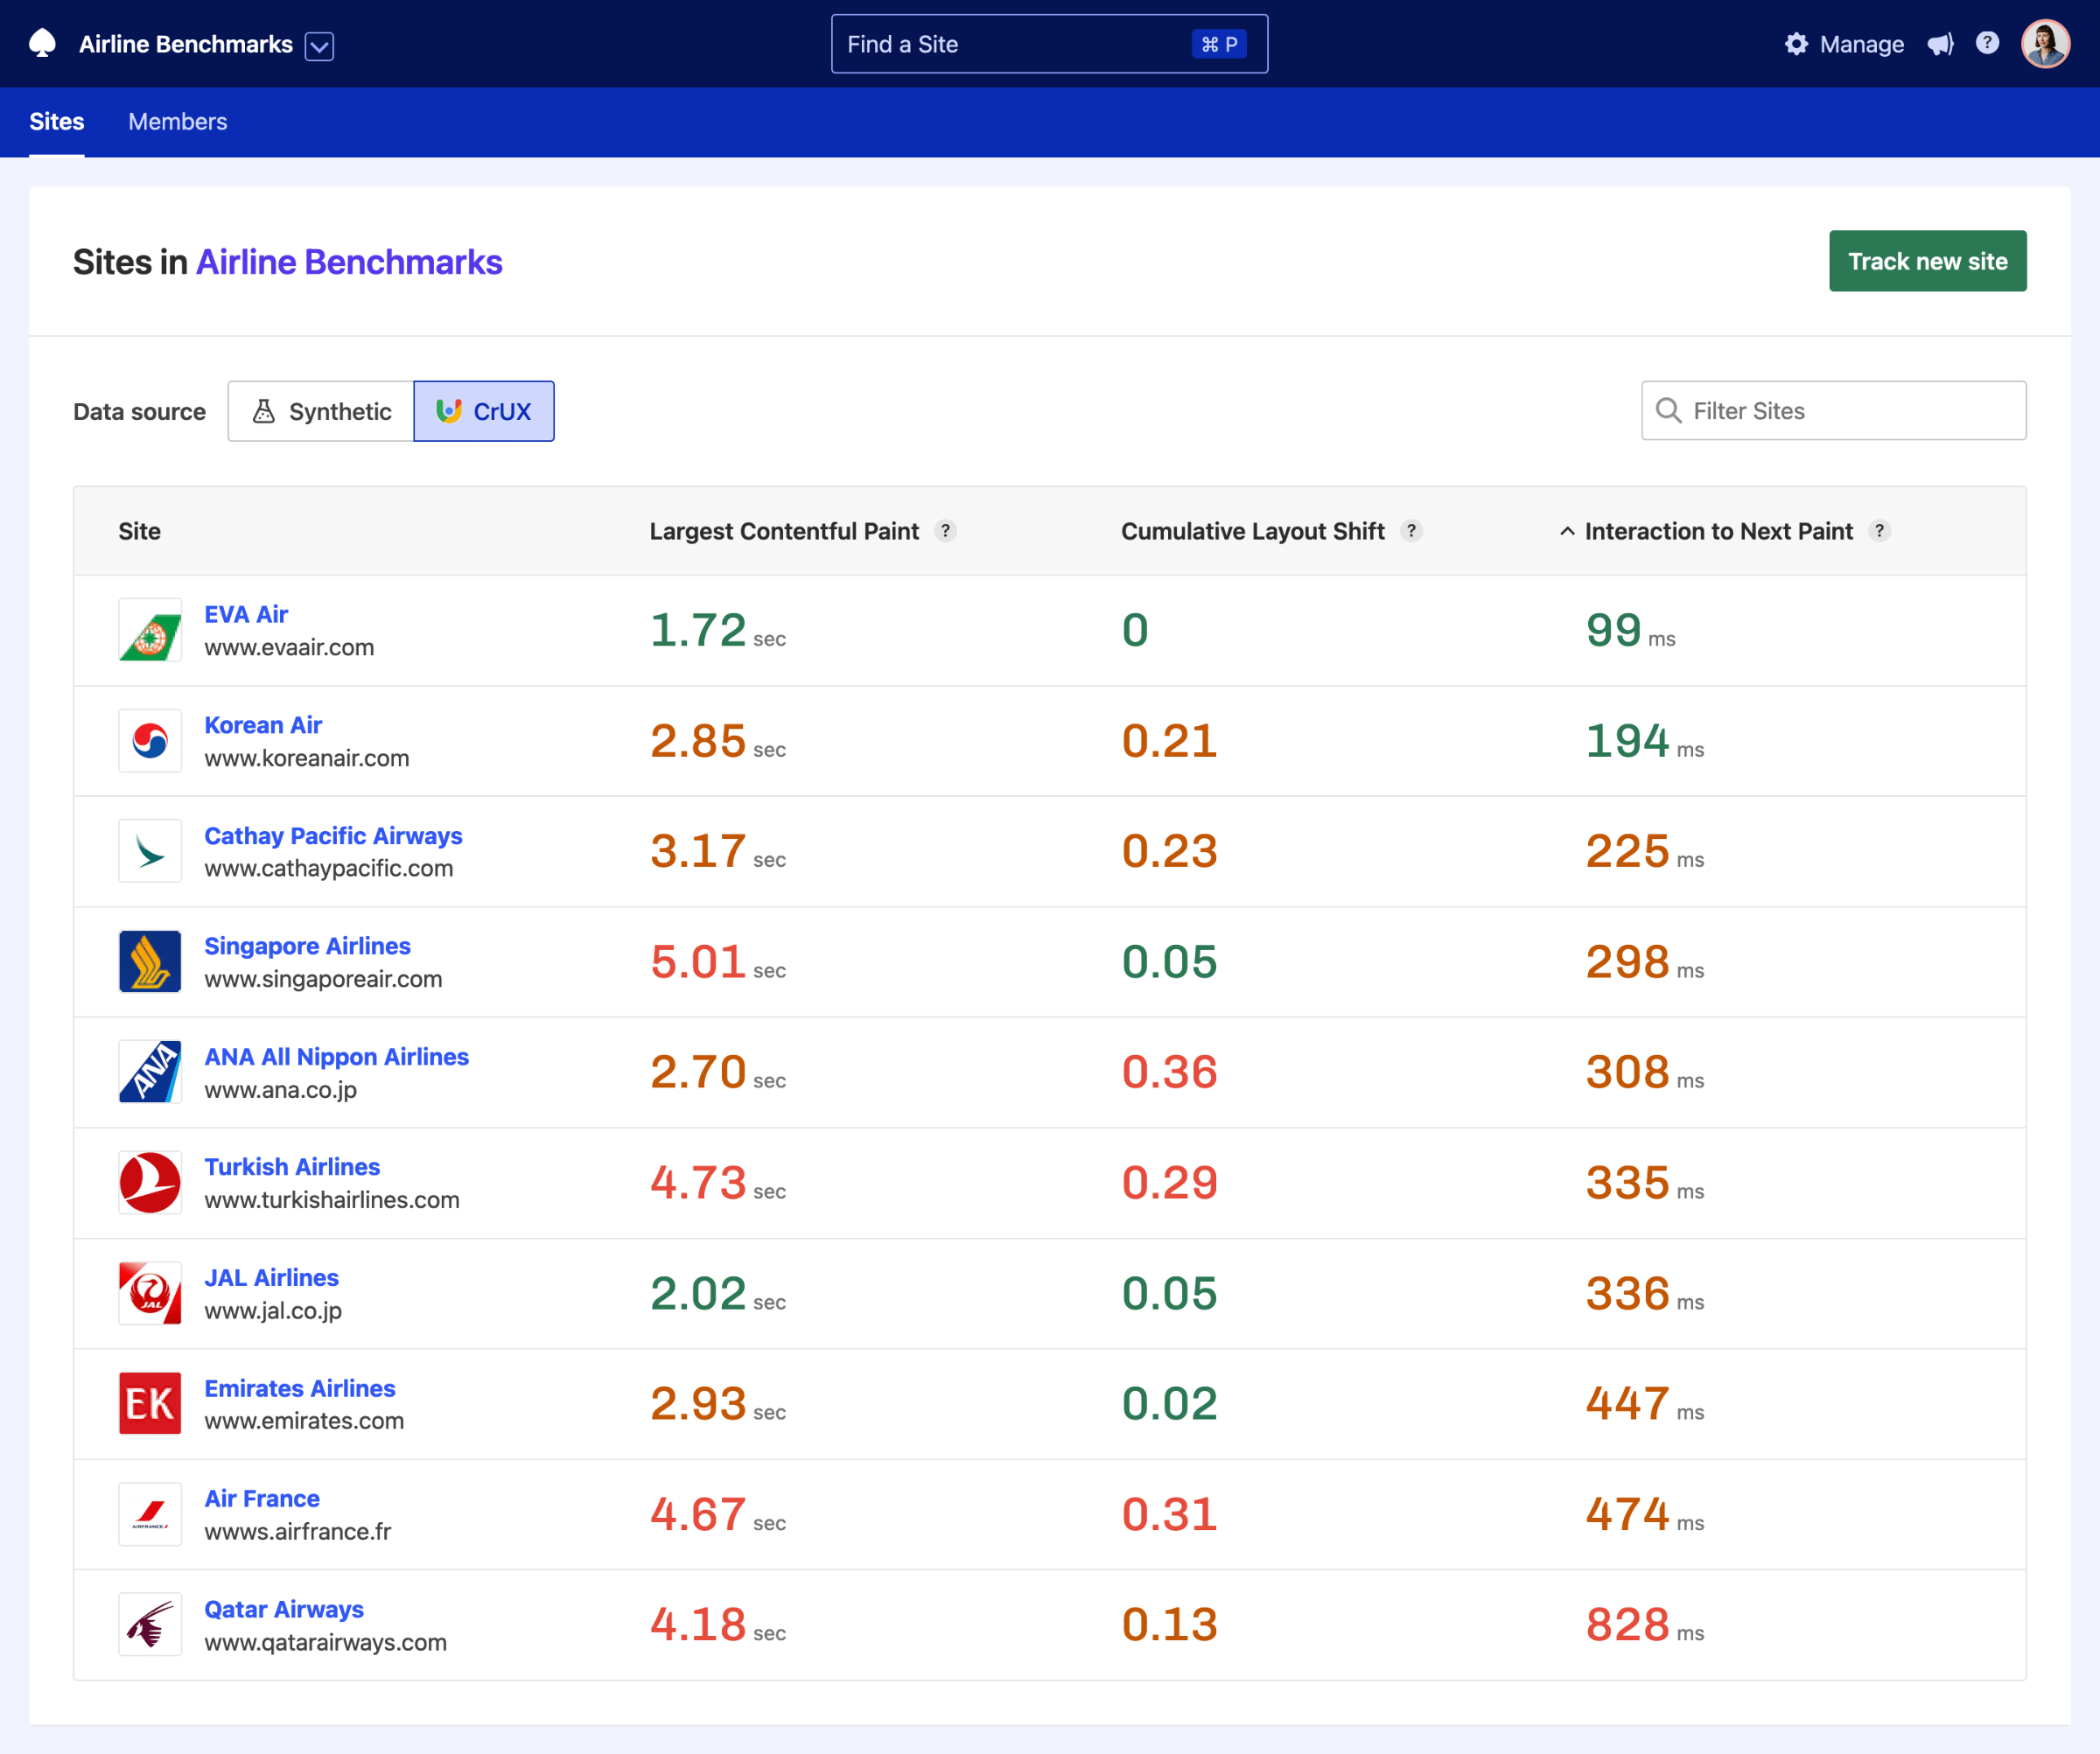
5 Sites regressed in performance for the Airline Benchmarks team workspace.
Each month, you can receive a Team Insights report for all the team workspaces that you’re a member of.
The report includes:
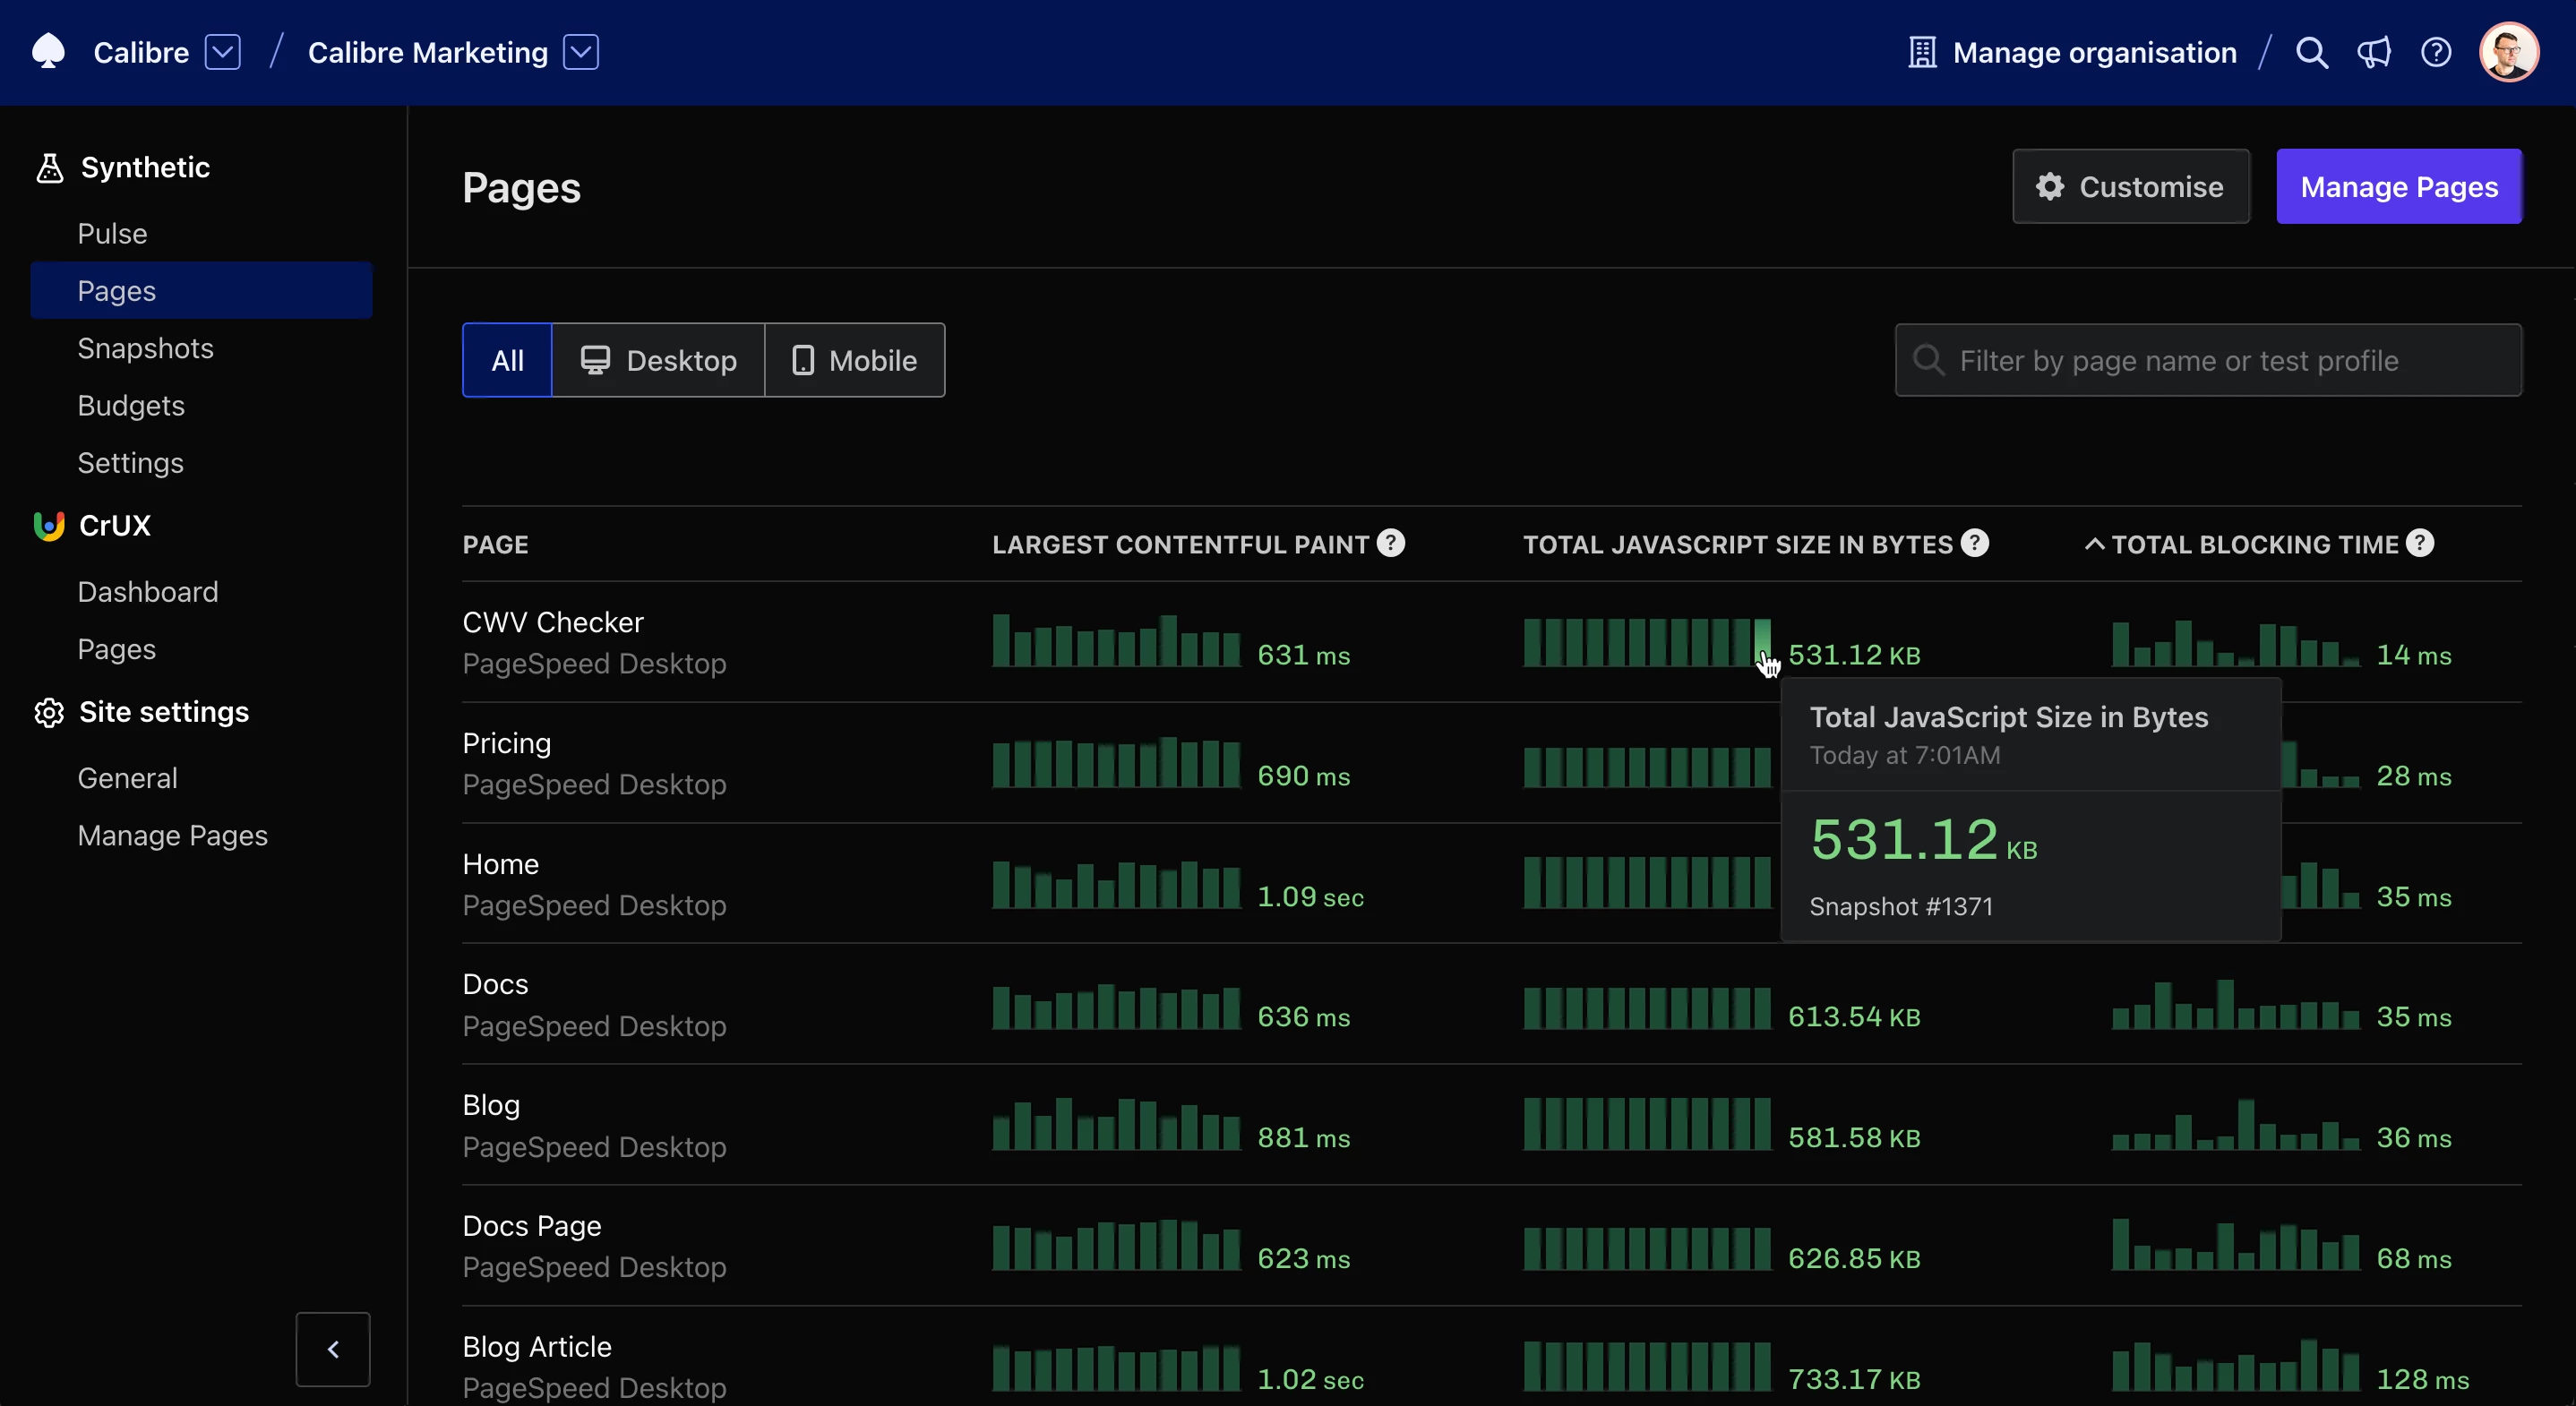
- Straight-forward data: Site’s performance metrics are evaluated and categorised into groups: Regressed, Improved, and Stable.
- Comparison to the previous month: Each Site’s data is compared to the previous month. e.g.: August vs September.
- Metrics at a glance: Each metric is colour-coded to indicate the severity of performance impact and significant changes to metrics are highlighted.
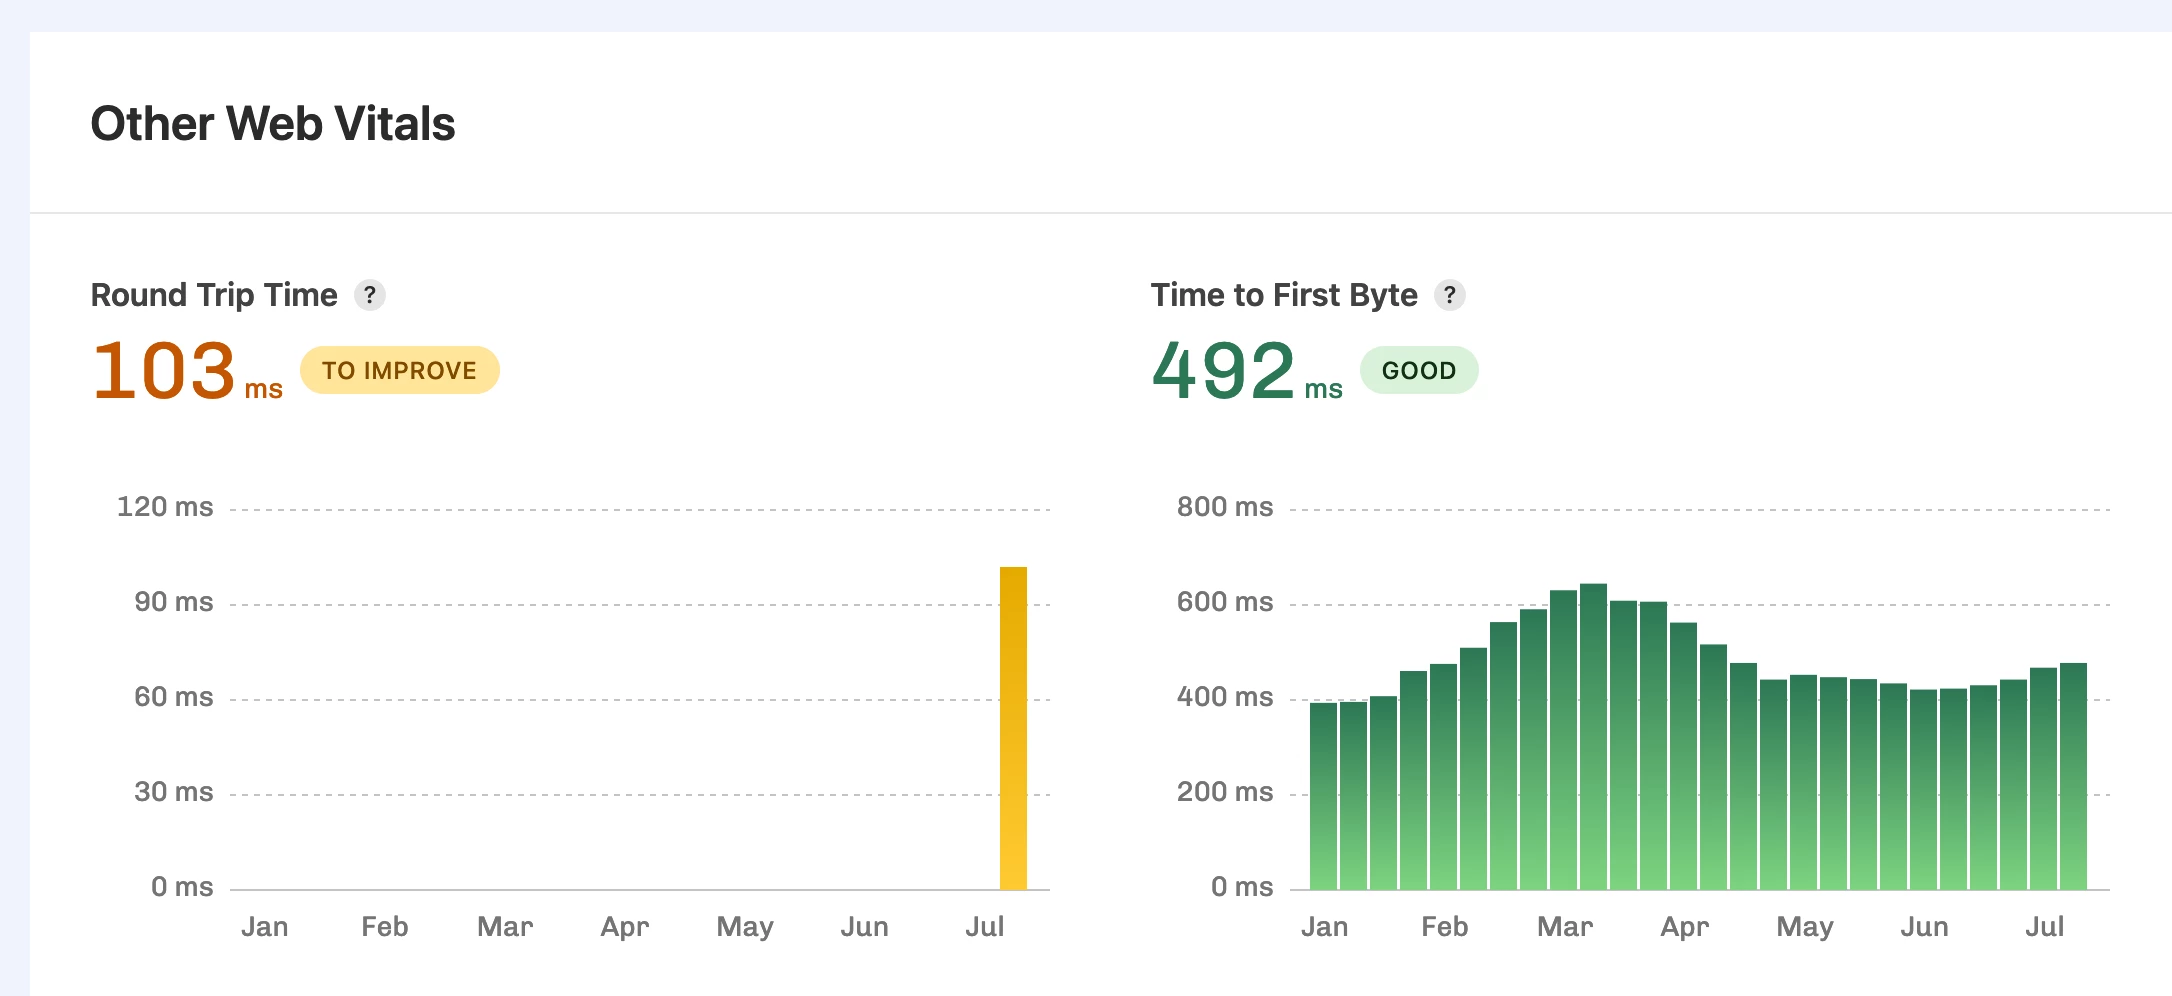
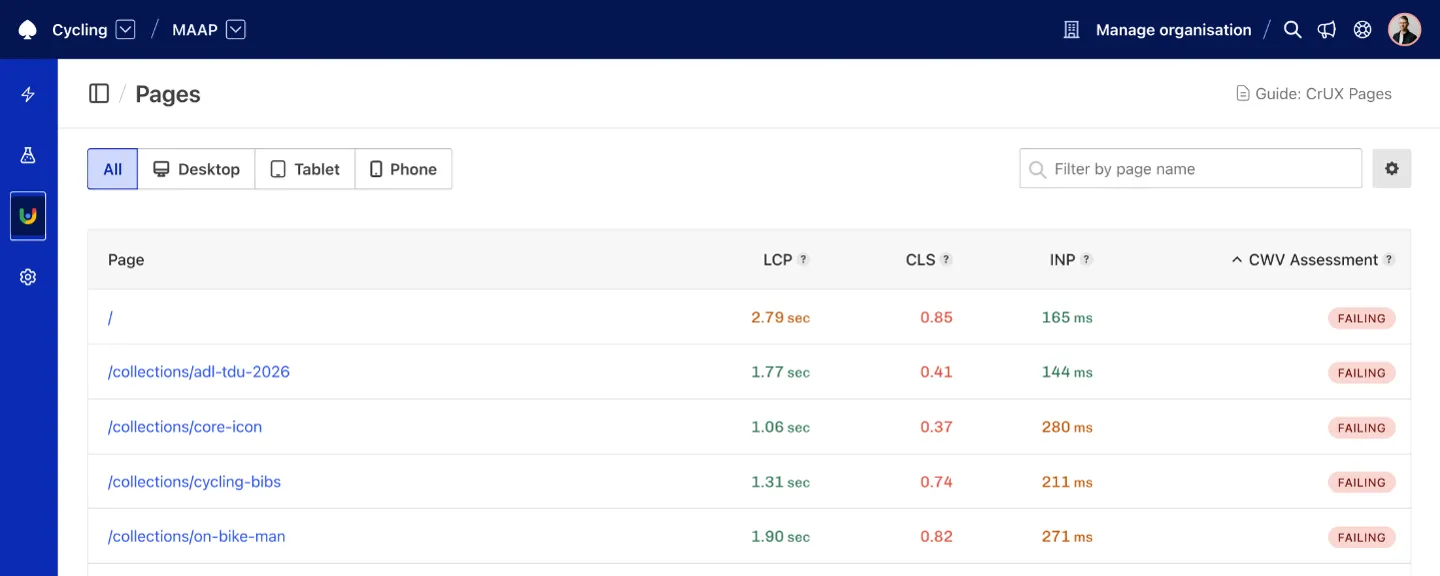
- Chrome User Experience Report (CrUX): Core Web Vitals metrics collected from real-user sessions. (Where available)
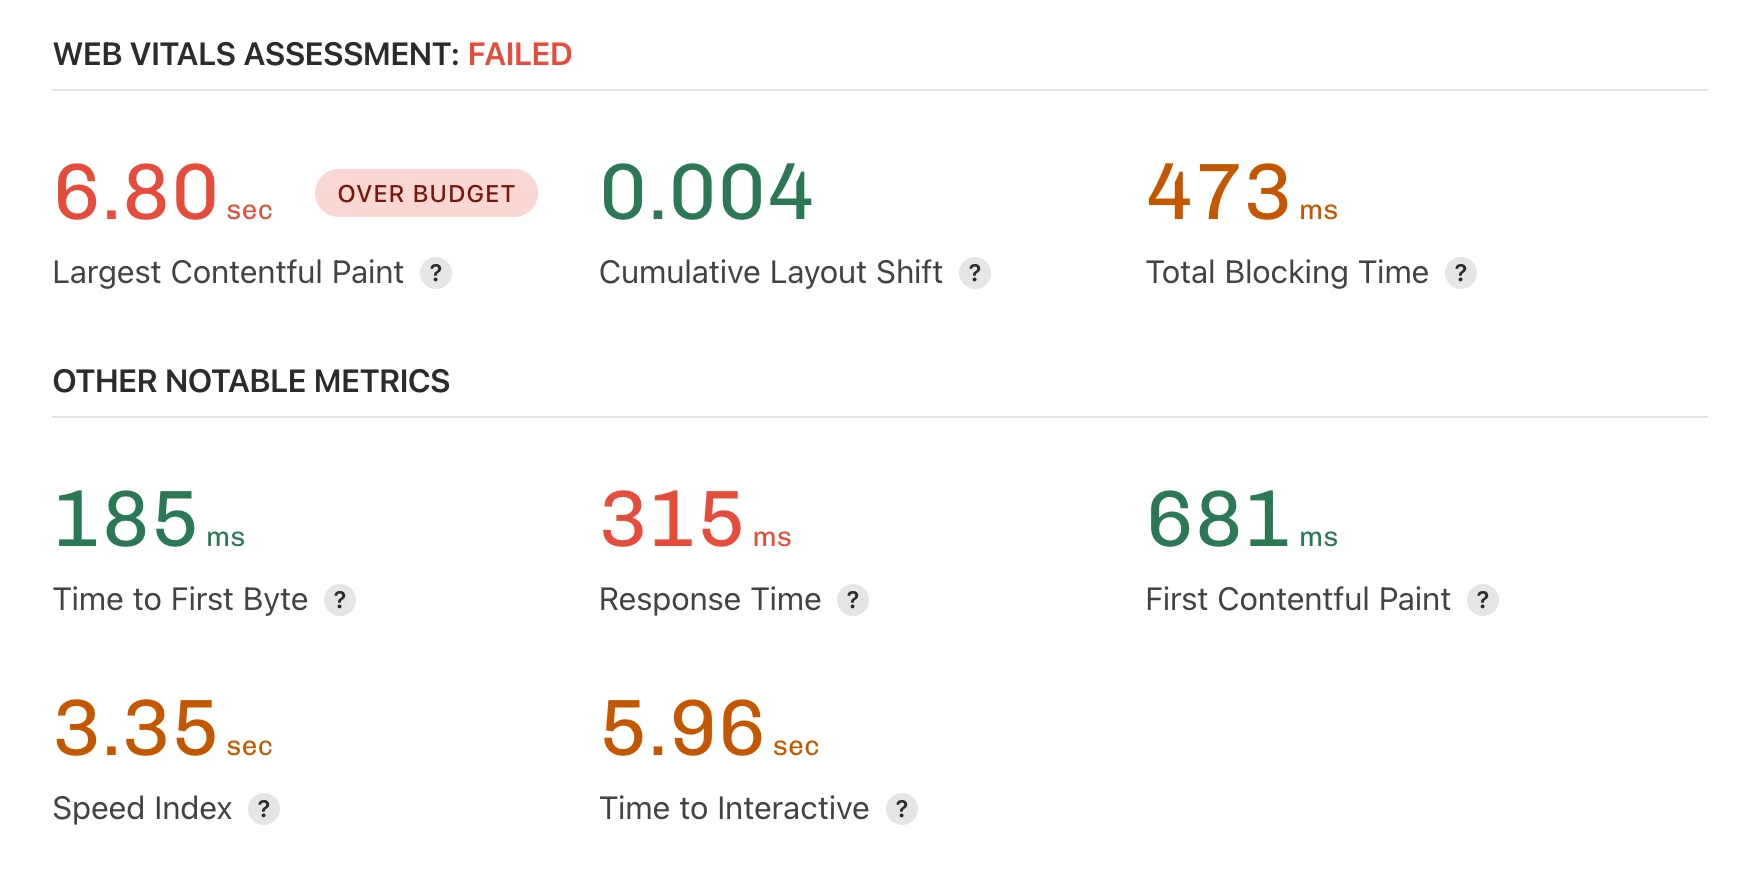
- Core Web Vitals Assessment: Clear indication of whether a Site is passing or failing Core Web Vitals.
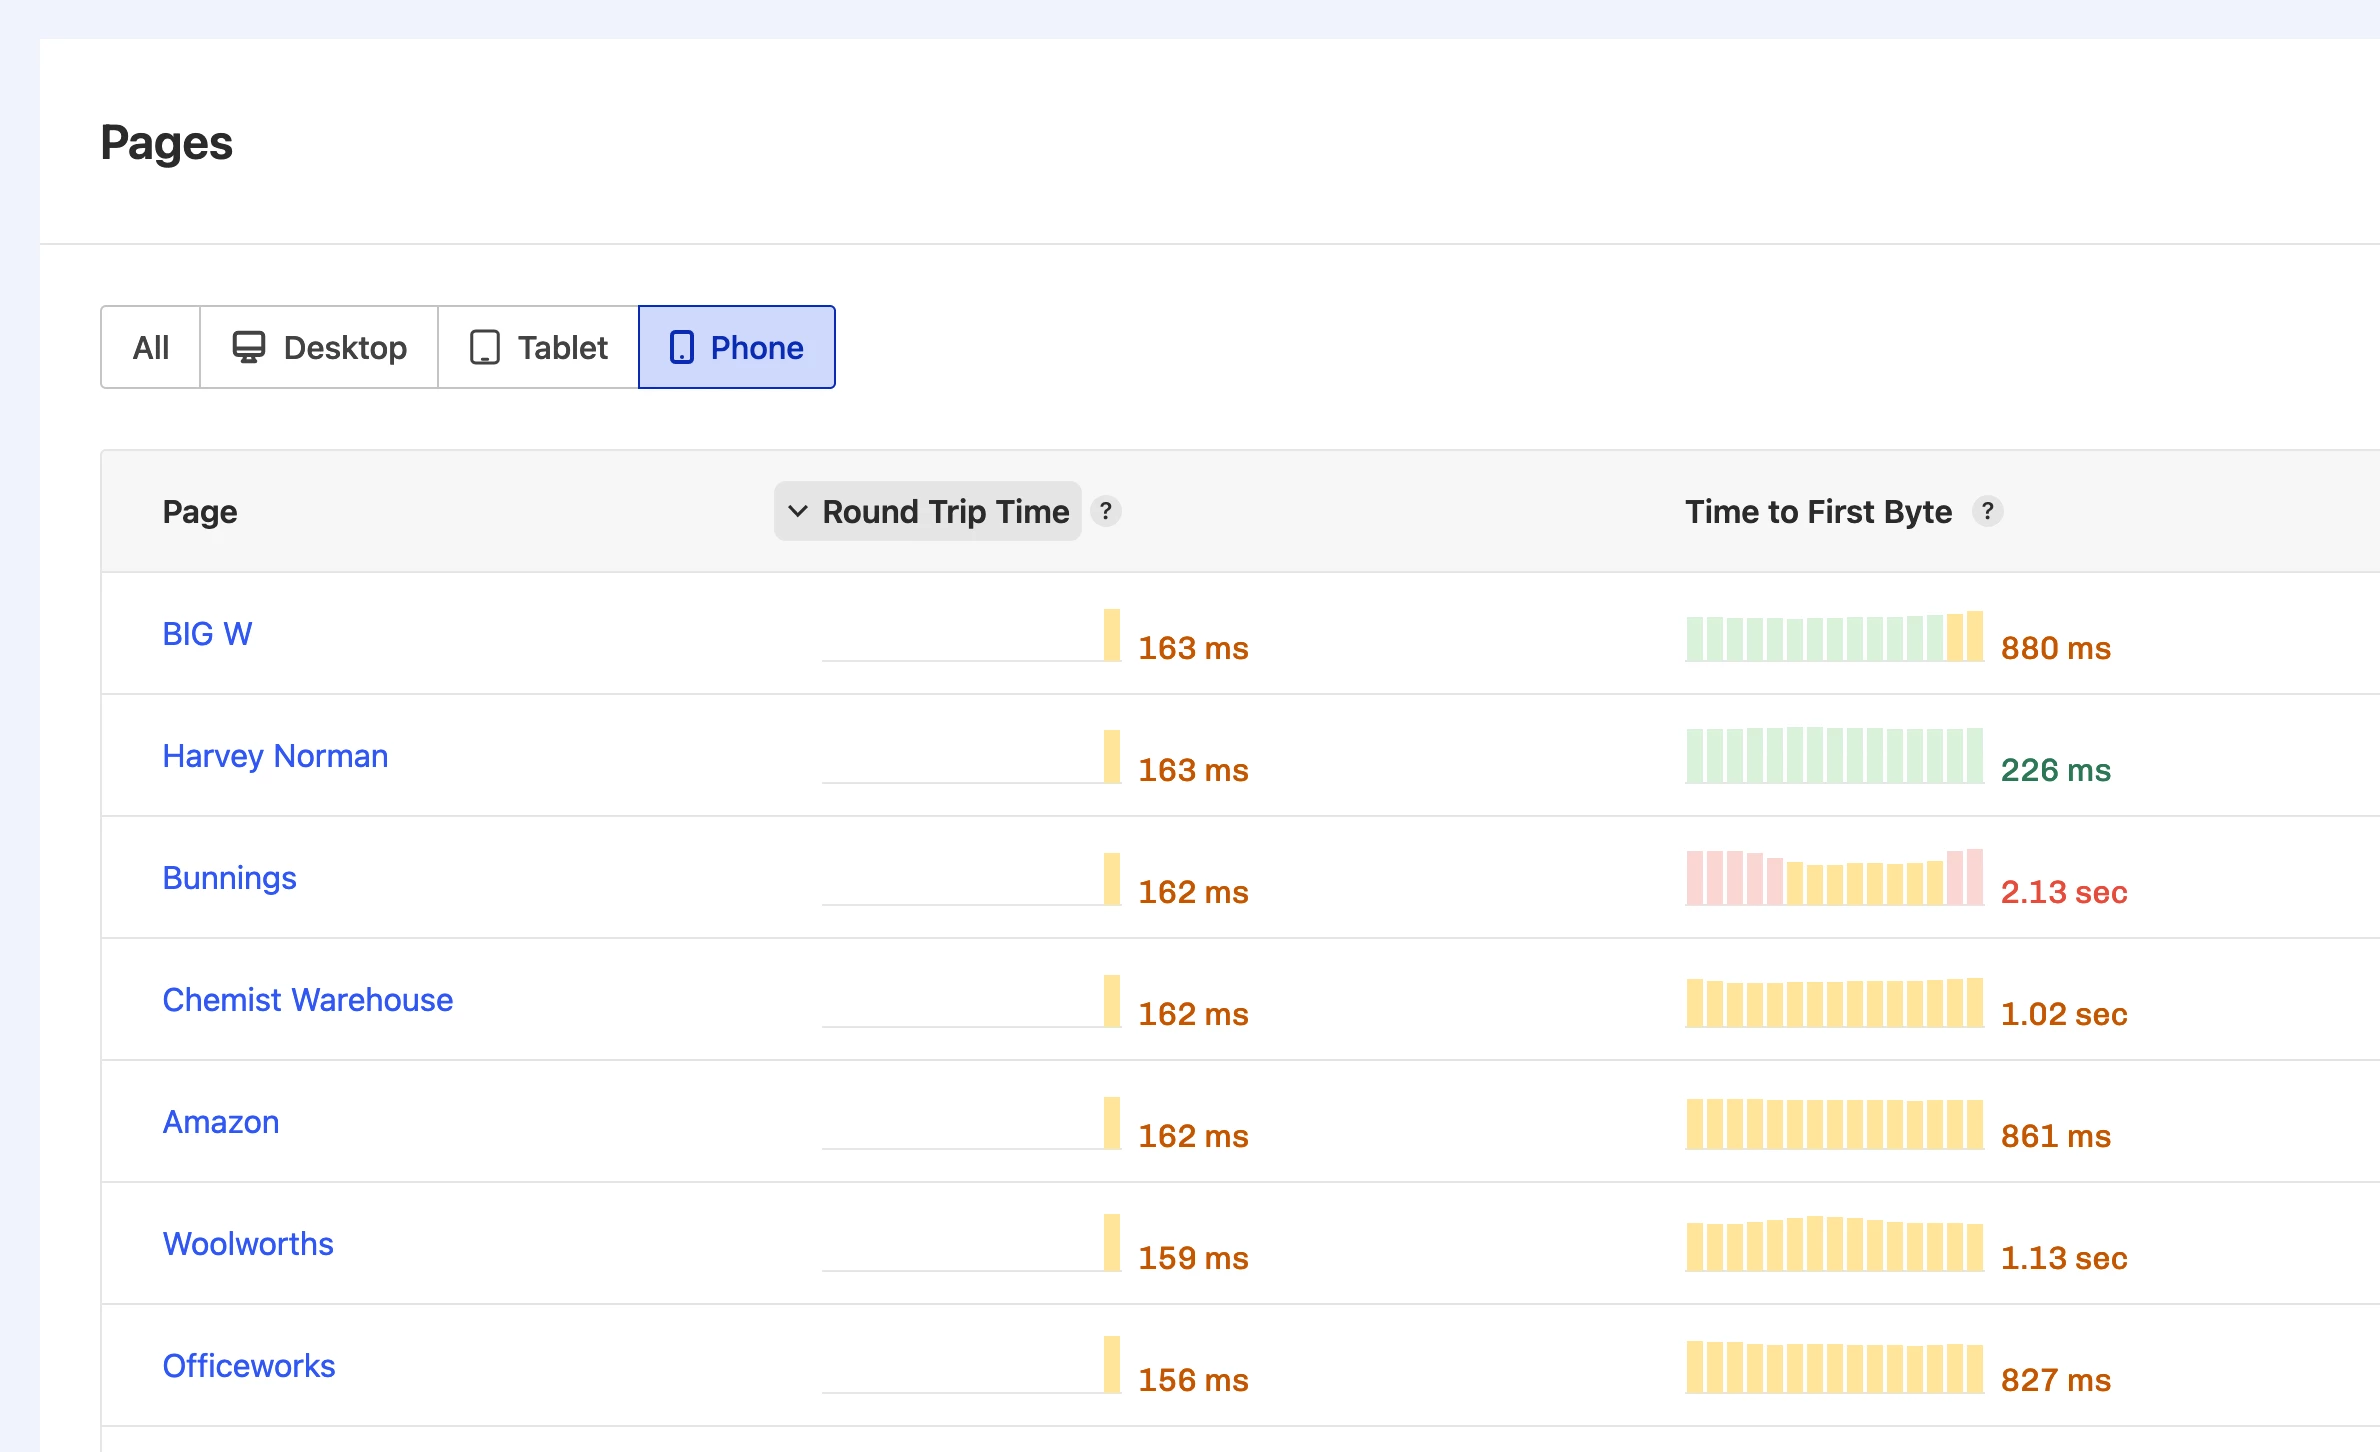
- Synthetic monitoring summary: See key metrics Largest Contentful Paint, Cumulative Layout Shift, and Total Blocking Time.
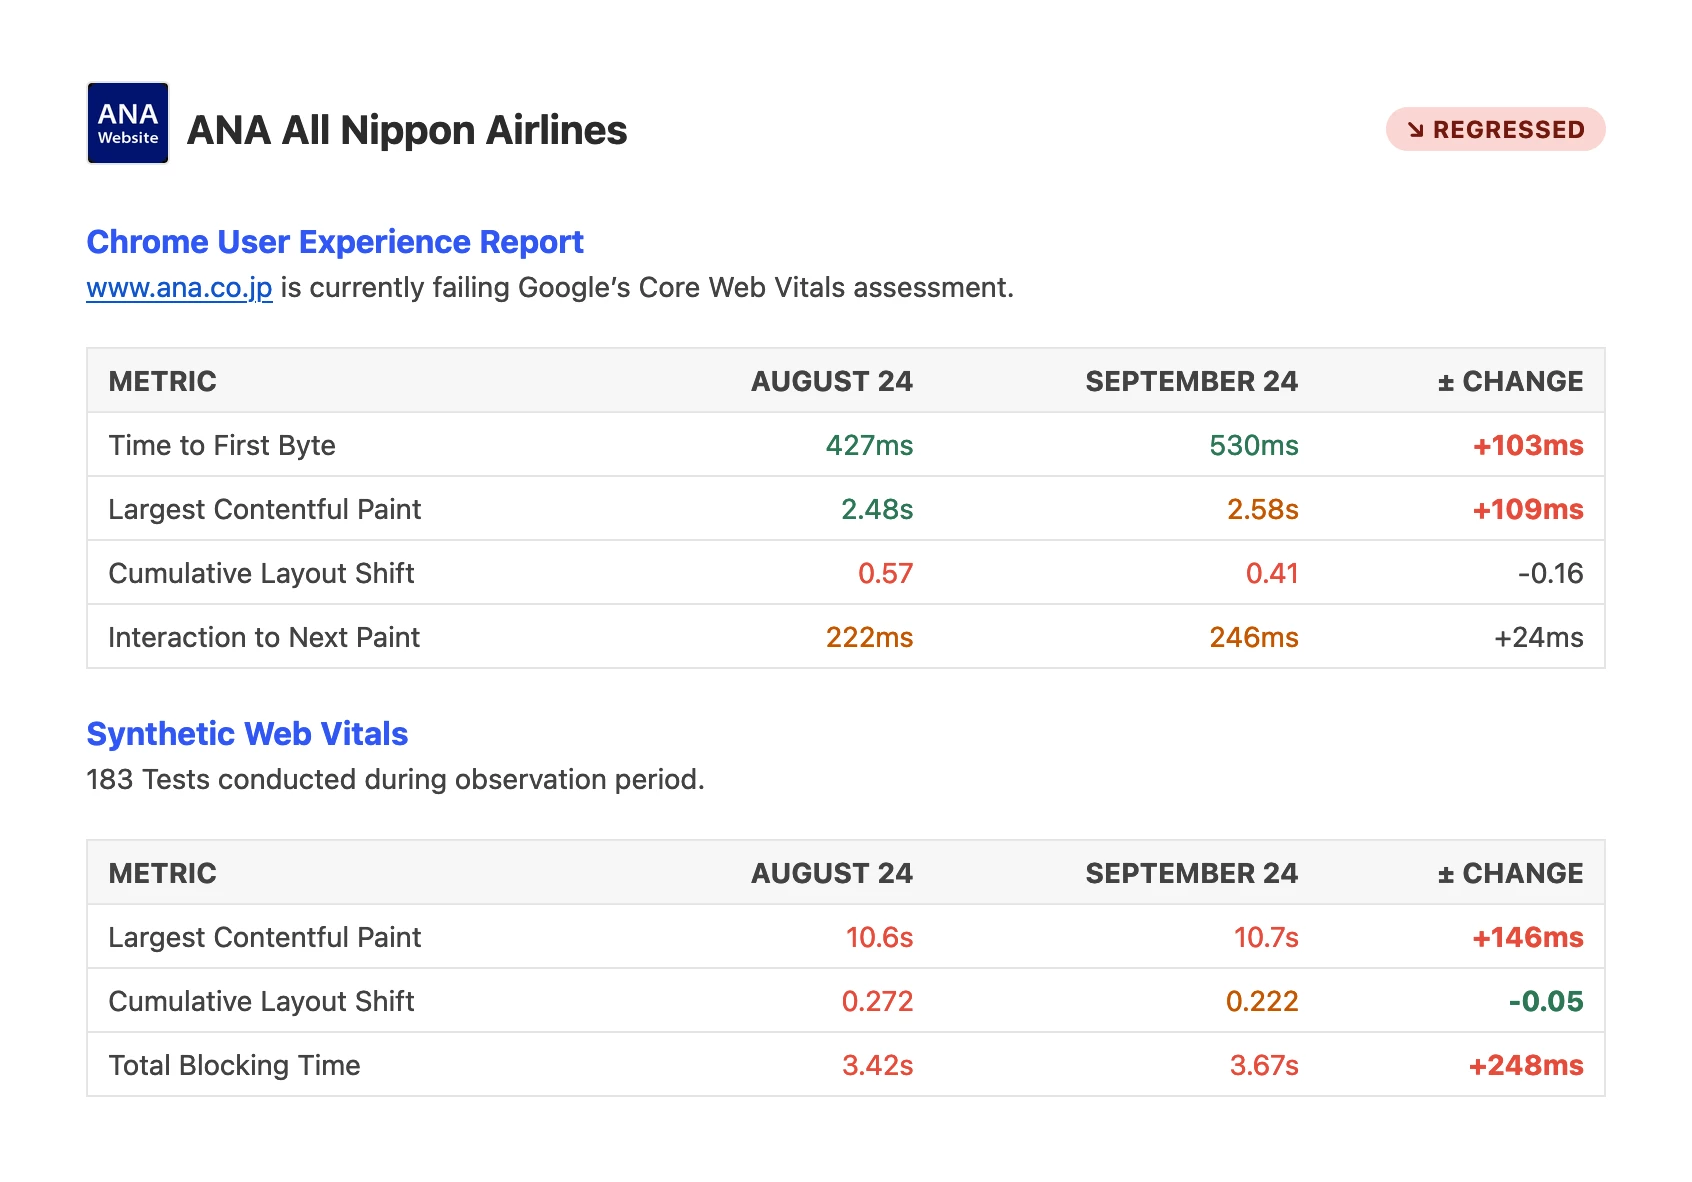
ANA All Nippon Airlines website regressed in September compared to August. Both CrUX and Synthetic data observed slower Largest Contentful Paint.
With this report, you can quickly see which Sites need attention, and also enjoy confirmation of hard-fought improvements.
Team Insights is available to all Calibre pricing plans and is automatically delivered on the 1st of each month. Team members can opt-out of Team Insights from notification settings if that’s their preference.
The first report will arrive 1st of November, or write to us if you would like early access.
We hope you find Team Insights a valuable addition to your performance monitoring workflow.