Our Test Agents are now using Chrome 119 and Lighthouse 11.3.0 to test your Sites. You can find details surrounding the 11.3.0 release in the official Lighthouse changelog.
Lighthouse 11.2.0 removed the “PWA” (Progressive Web App) category for its tests. Inline with this change, Calibre no longer records PWA score metrics. You can access historic PWA scores and audits by downloading pre-11.3.0 reports via the Calibre API, or by downloading lighthouse.json from the Calibre UI.
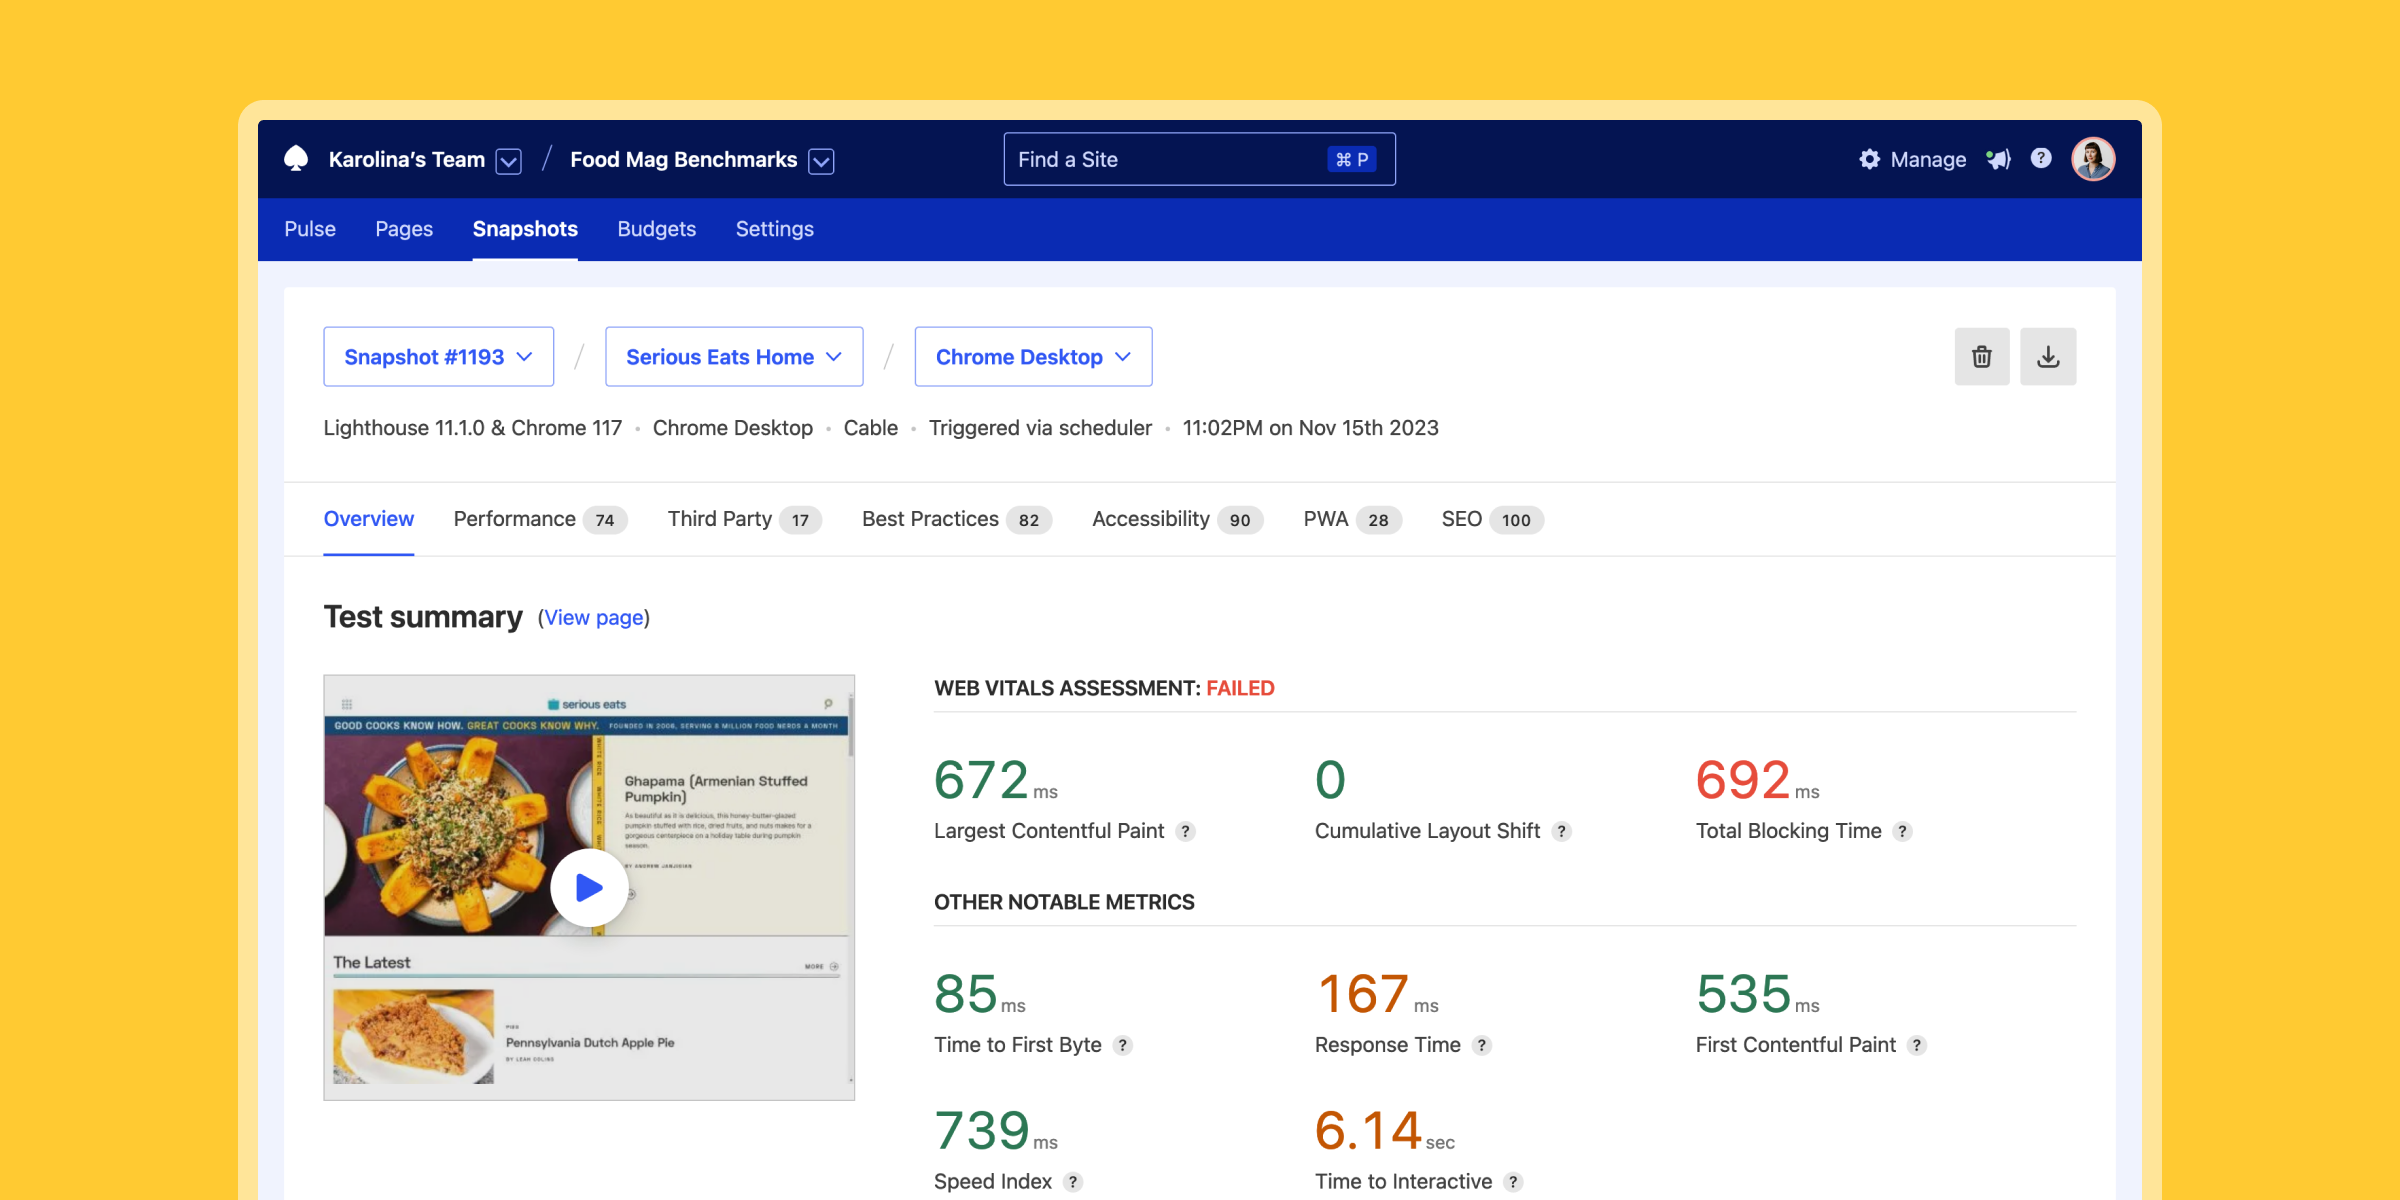
Single performance tests are a great way to find the reason for observed metric changes that might be caused by requests or asset change. Because we see Snapshots as a critical discovery tool, today we’ve released numerous improvements to Snapshot Overview that make investigating the performance of a page much easier.
With the new Snapshot Overview, you can:
Easily check the web vitals assessment status
Check test progression and address authentication errors
Correlate key paint metrics to render screenshots
Analyse long tasks and assets for first and third-parties
Customise the request table display and find requests easier
View the new Snapshot Overview by choosing a test in Site → Snapshots. You can also learn more in the release blog post.
We released a new patch version of our React Live Chat Loader package. In this release, we bumped outdated dependencies and addressed a bug that had caused the distribution bundle to drop support for ES5.
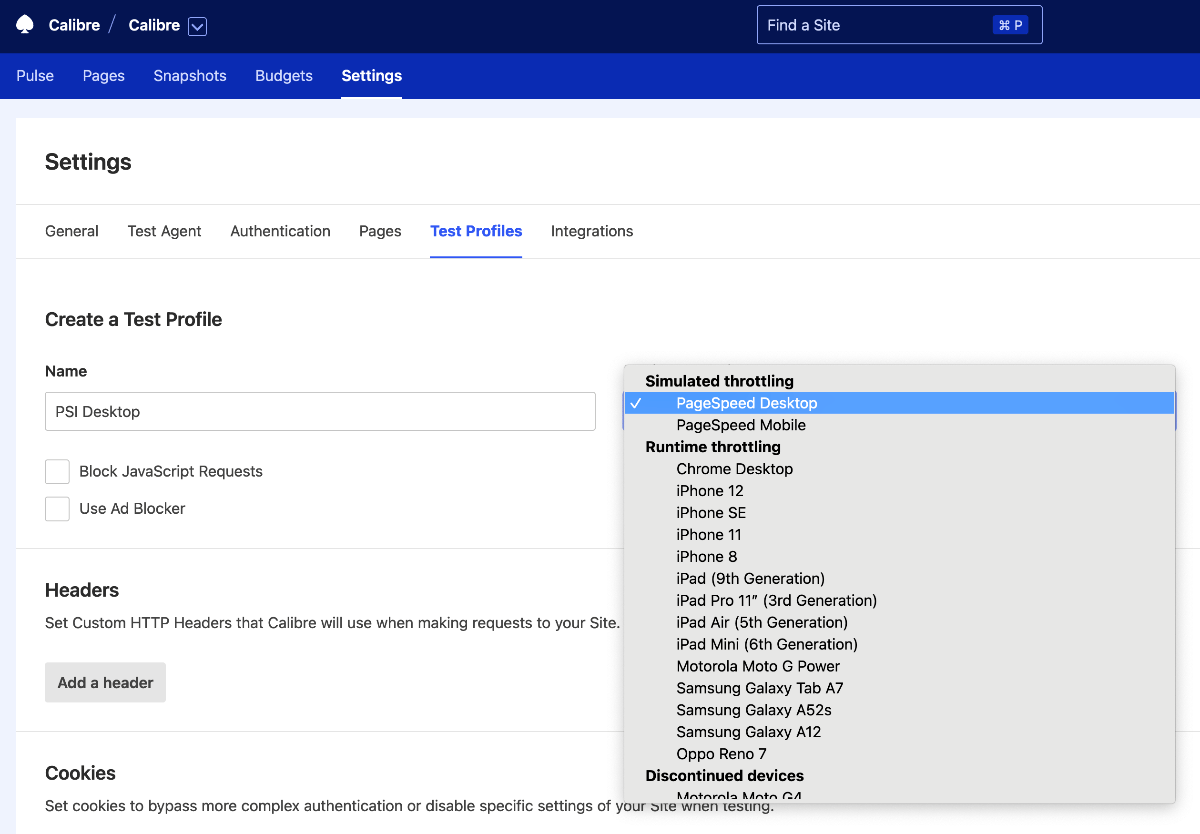
Calibre Test Profiles allow you to specify an emulated device and network throttling for your tests. Until today, all device and network throttling was applied during runtime, meaning that the throttling was applied to the browser as it was running the test.
Google’s PageSpeed Insights uses a different approach. It runs page tests at full, unthrottled speed, then performs a simulation of the throttling that would have been applied to the page load.
Today, we have added a new option to Calibre Test Profiles that allows you to run your tests with the same simulated throttling as PageSpeed Insights. Now, there are two new Test Profile options:
PageSpeed Desktop
PageSpeed Mobile
These two device options will run your tests with the same throttling settings as PageSpeed Insights. While we don’t recommend comparing monitoring from different tools, this option will allow you to compare your Calibre tests with PageSpeed Insights tests more closely as the test conditions will be more similar.
To start testing with PageSpeed simulated throttling, create or update an existing Test Profile in Site → Settings → Test Profiles.
Our Test Agents are now using Chrome 117 and Lighthouse 11.1.0 to test your Sites. You can find details surrounding the 11.1.0 release in the official Lighthouse changelog.
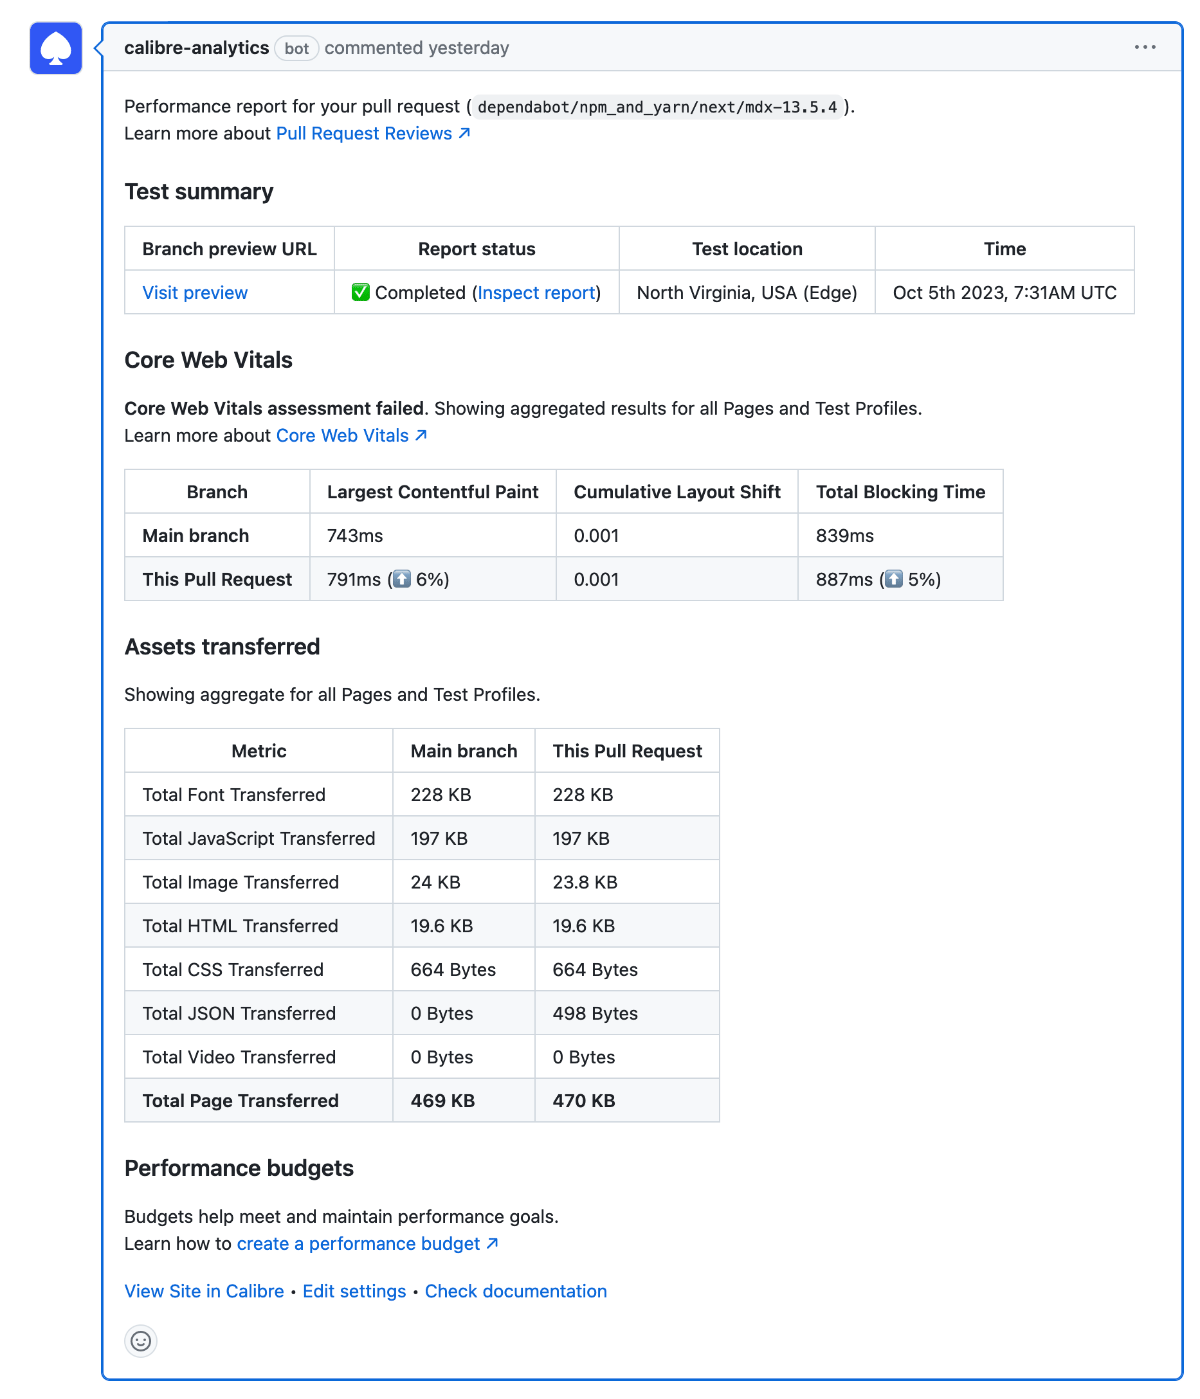
Designed for use with CI/CD systems, CLI Pull Request Reviews are a way for Calibre to compare production (or another environment) to a preview deployment (e.g.: your work-in-progress branch). Each Pull Request review generates a comparison report outlining any key changes in site speed, which can be used to make decisions about whether to merge the branch or not.
You can automatically fail builds when performance budgets are no longer met using the --failOnUnmetBudget flag, too!
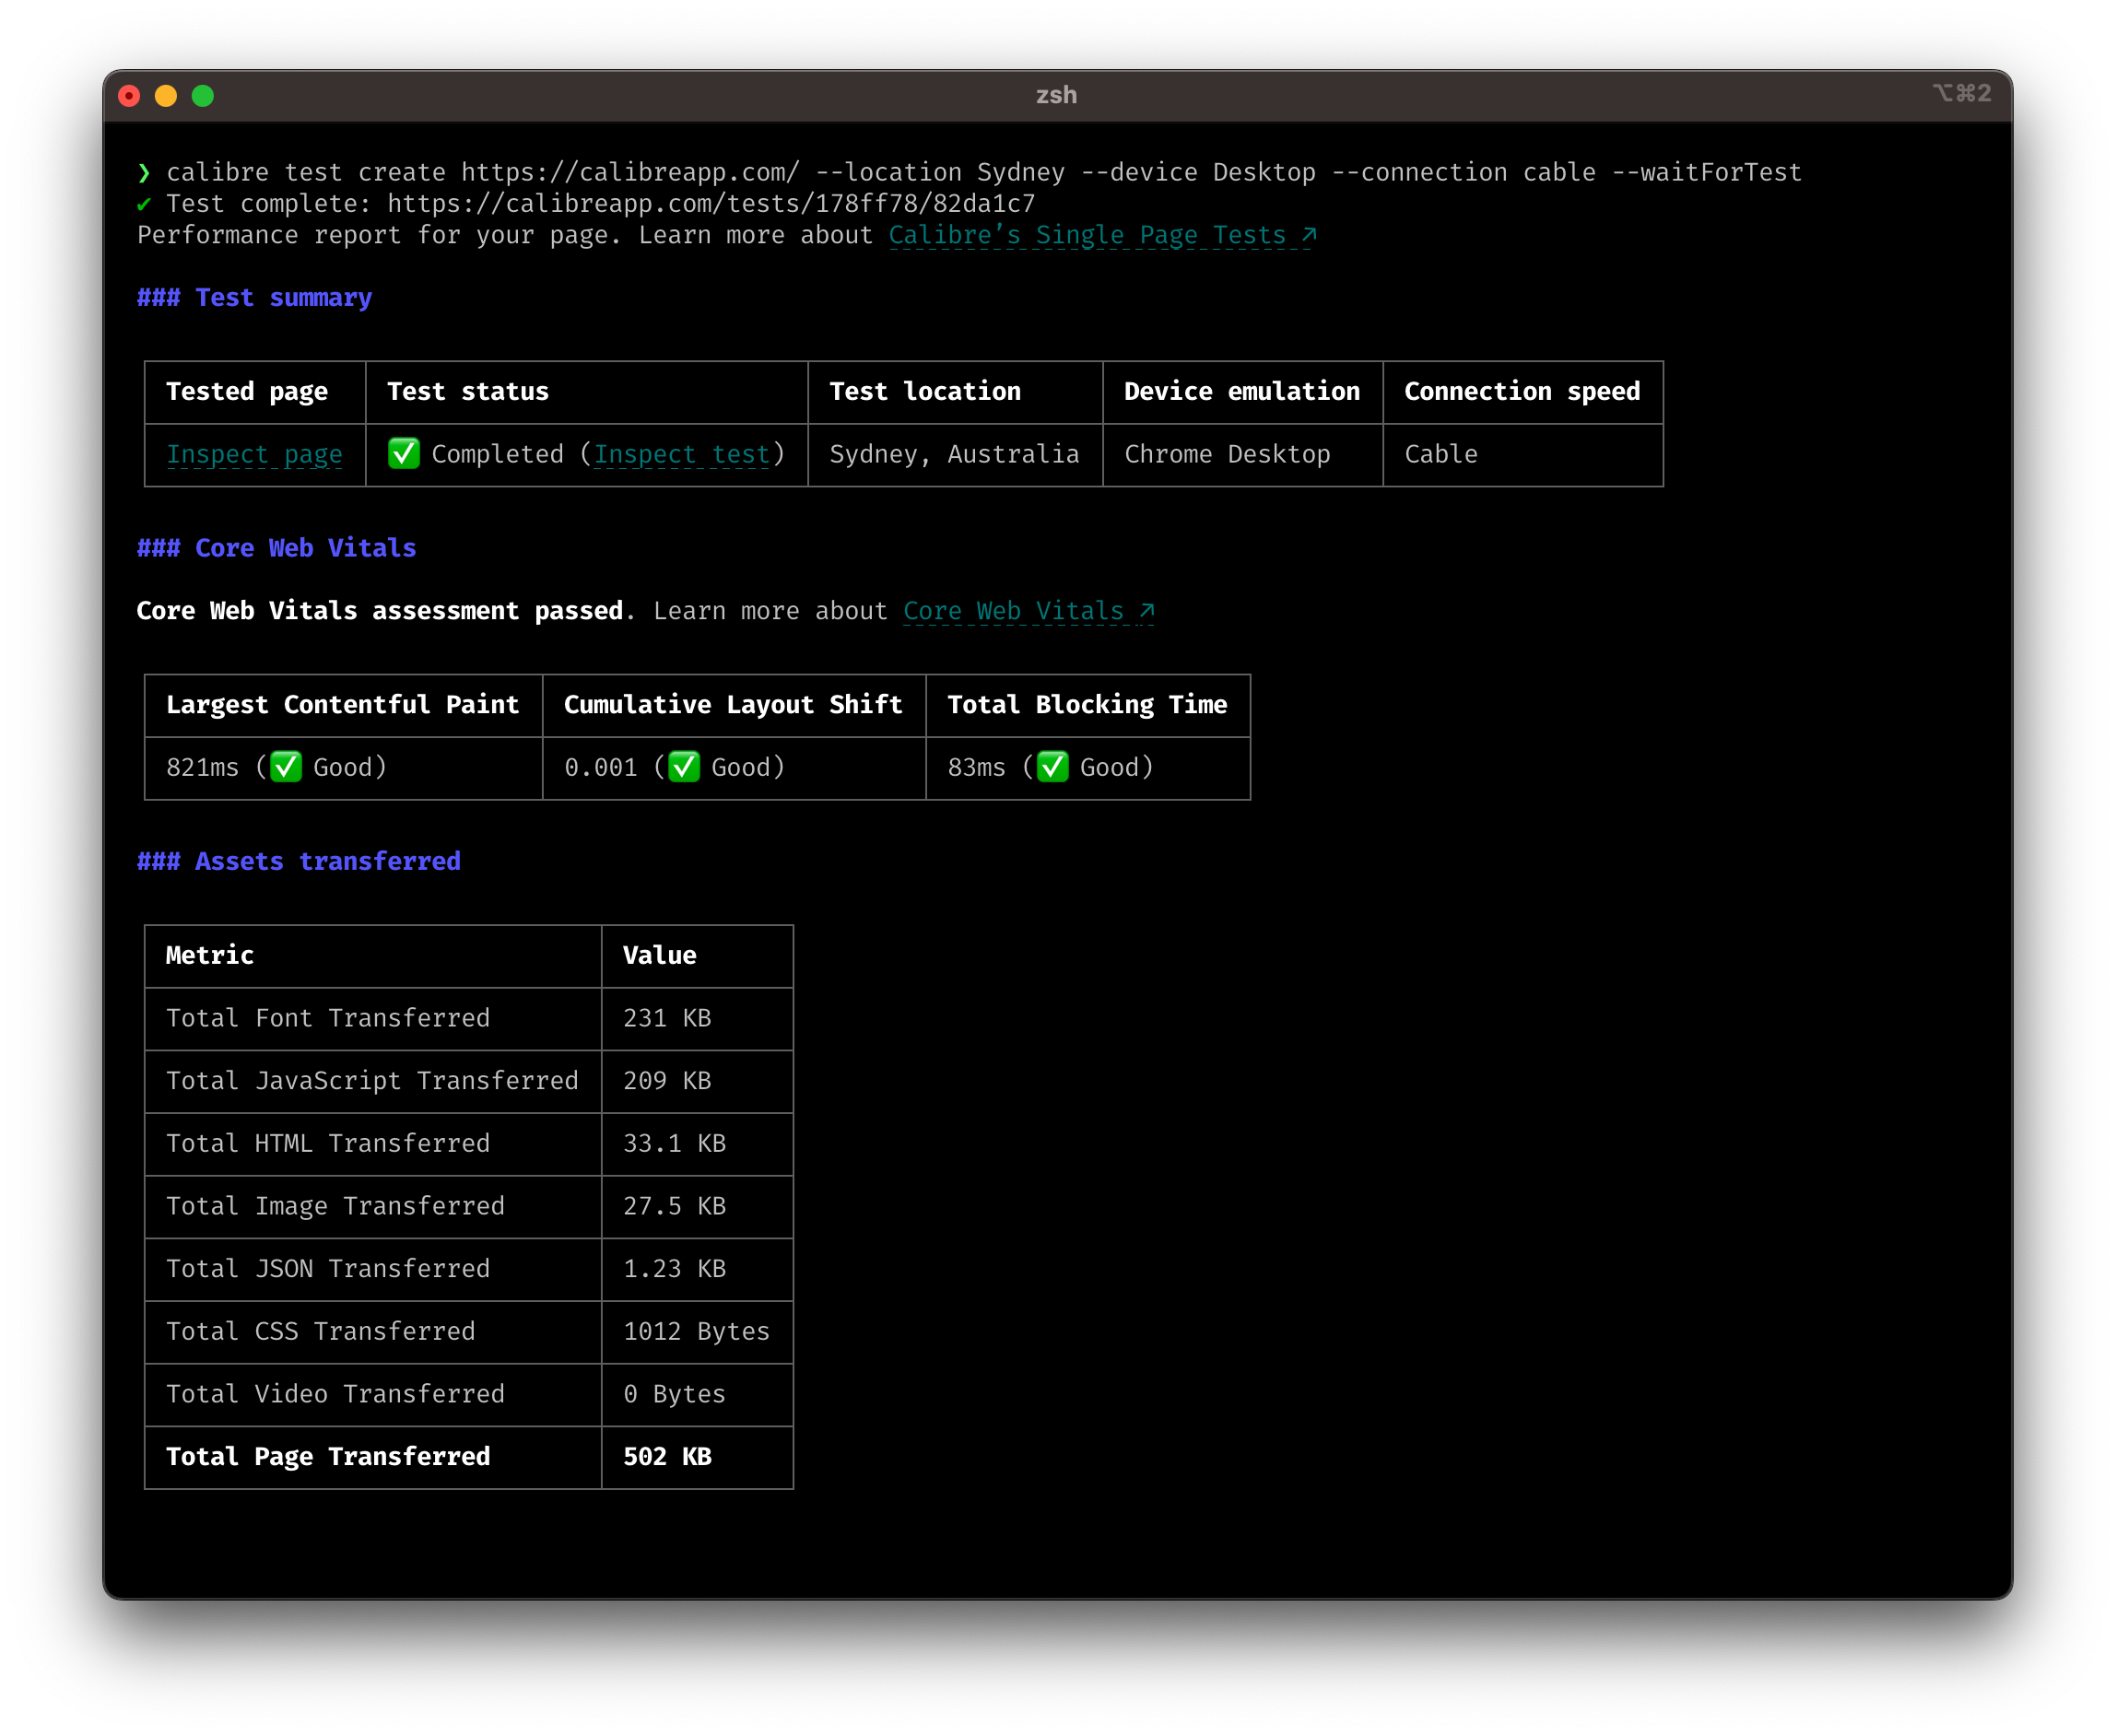
Single Page Tests now generate a markdown-powered performance report. You can use this output with other tools that support markdown rendering like GitHub, GitLab and Bitbucket to ensure that all the code you release is reviewed for performance and best practices.
When creating a Single Page Test, you can now specify a Webhook URL to post test results to. Using this new technique, you can run async tests and have the results delivered to a custom endpoint of your choosing. You can use --webhookSecret to verify the incoming webhook using HMAC.
npx calibre test create https://calibreapp.com \
  --location Sydney \
  --webhookUrl="https://webhooks.example.com" \
  --webhookSecret="my verification secret"
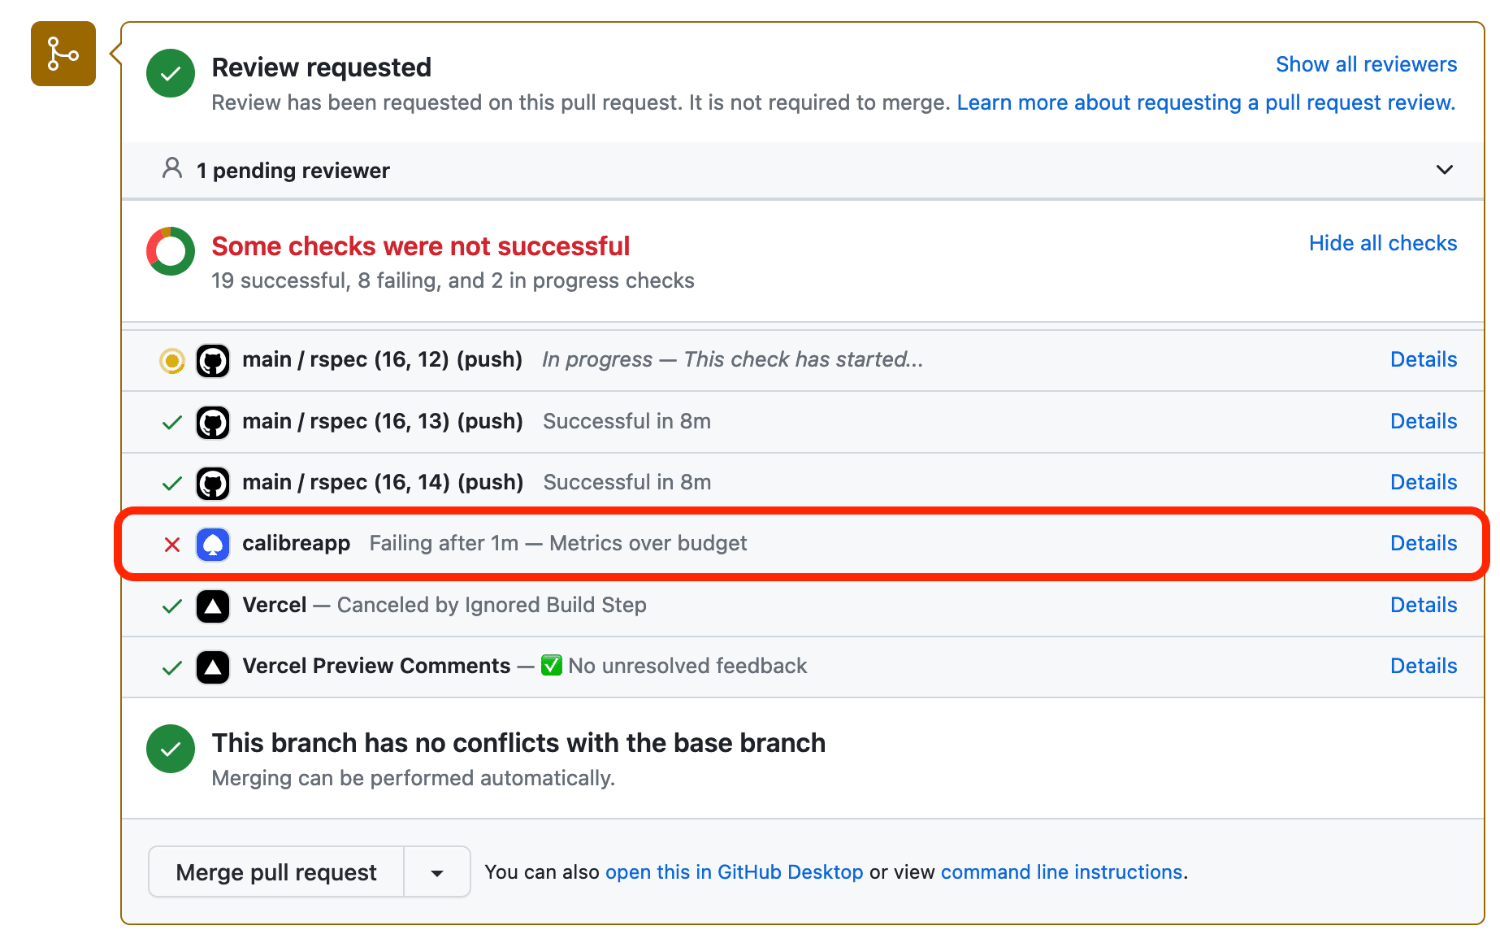
If you are using Pull Request Reviews to test the performance of your changes in GitHub, you can now be even more proactive with enforcing budget limits.
We added an option to fail Calibre’s budget checks if the pull request exceeds the budget that’s currently passing on the production site. Turn pull request fail checks in Site → Settings → Integrations → GitHub.
Having automations in place, monitoring a non-critical site or a preference for viewing data in-app rather than receiving emails are just a handful of reasons why you might like to create Performance Budgets without email notifications.
Our Test Agents are now using Chrome 116 and Lighthouse 11 to test your Sites. You can find details surrounding the 11.0.0 release in the official Lighthouse changelog.
Chrome 116 introduced updates that affect how Largest Contentful Paint (LCP) is evaluated and calculated. You can read details of these changes on the official Largest Contentful Paint changelog.
There are dozens of ways to keep up-to-date with new releases from products your team is using. To make it easy, and accessible without leaving Calibre, we added a notification to the main navigation that signifies unread Changelog posts.
We have several major releases coming in the near future, so it’s a good time to be checking in on what’s new!
From July 4, 2023, test artifacts (lighthouse.json, har.json and other test JSON reports that Calibre stores) will be compressed with the Brotli algorithm. This change brings 15-30% smaller downloads compared to previously used compression with Gzip, which also results in faster downloads.
Customers using the Node.js API or Command Line Interface to access test artifacts should update to version 5.0.4, which has been released as a result of this change. You only need to update if you are using the following functionality, or commands:
If you have a custom API integration, you will need to ensure that artifacts with a response header Content-Encoding with value br are decompressed using Brotli. Tests recorded before this change will remain compressed with Gzip.
From July 6, 2023, Calibre will require all webhook Integrations to use the HTTPS scheme. Existing Webhook Integrations can continue using plain HTTP until that date, but after July 6, we’ll automatically turn off webhook integrations which have not been updated to use HTTPS.
You can review your webhook integration settings by visiting Site → Settings → Integrations.
The upgrade from Lighthouse 9.x to 10.x introduces several changes to the way Lighthouse calculates performance metrics. You can find details on the official Lighthouse 10 changelog.
Lighthouse dropped the inclusion of Chrome-Lighthouse in the User-Agent header; however, Calibre will continue to include this header.
Previously unknown Third Parties are now identified by the Third Party report. You may notice an increase in Total Third Party Code Transferred or Total Third Party Main Thread Execution Time metrics as a result of newly identified third parties.
As a consequence of first two points, your Performance Score might change.
Our Test Agents are now using Chrome 113 to test your Sites.
Chrome 111 and 112 introduced updates that effect how First Contentful Paint (FCP), and Largest Contentful Paint (LCP) are evaluated and calculated. You can read details of these changes on the official Largest Contentful Paint changelog.
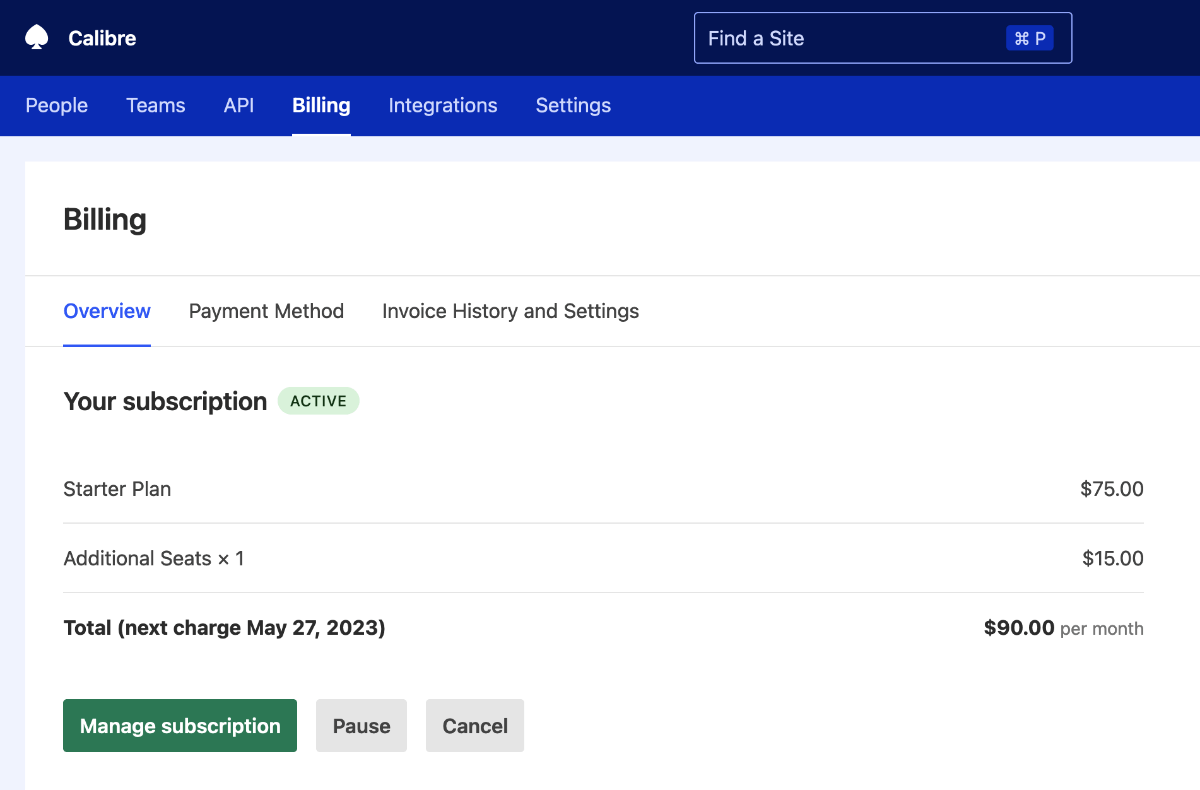
Managing service subscriptions can be unnecessarily difficult. Every so often, you might want to pause payments while your team changes focus, re-evaluates tools or needs a breather. That’s why we introduced the ability to temporarily pause your Calibre subscription.
Organisation administrators can pause subscriptions on the Billing → Overview page.
We have added the ability to sort tables within the Lighthouse audits (Performance, Accessibility, SEO, Best Practices and PWA):
Sortable tables allow you to focus on the metrics most relevant to your requirements and quickly identify areas that need improvement, along with those performing well.
Head to a Snapshot and browse the Lighthouse audits to see the new sortable tables in action.
We have made several improvements to reliability of Pull Request Reviews in GitHub:
Fixed an issue where Calibre was creating Snapshots in Pull Requests when it was set up to ignore branches (for example: !* in the Deployment branches settings).
Fixed an issue where Pull Requests that were correctly marked as ignored (by Deployment branches settings) would get tested because the Pull Request was opened as a Draft, then moved to Ready for Review.
Added a missing informative message where a test result was neutral (there was no action from Calibre’s side).
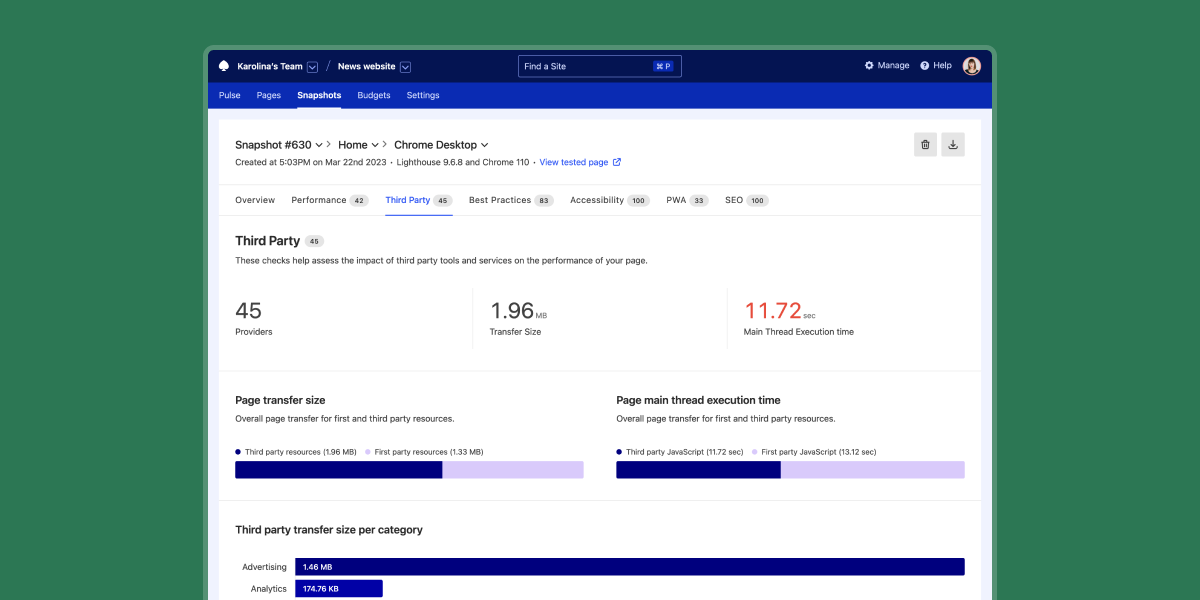
We refreshed the Third Party page, so you can quickly assess the impact of external tools and scripts on performance. The report visualises how first and third-party resources contribute to page transfer size and main thread execution time. You can also quickly pinpoint which category of tools is the most costly, whether it’s bandwidth or time.
Soon, we’ll be adding more information about third-party requests, including details about file types. You can view the Third Party report by navigating to a Snapshot and clicking the Third Party tab.
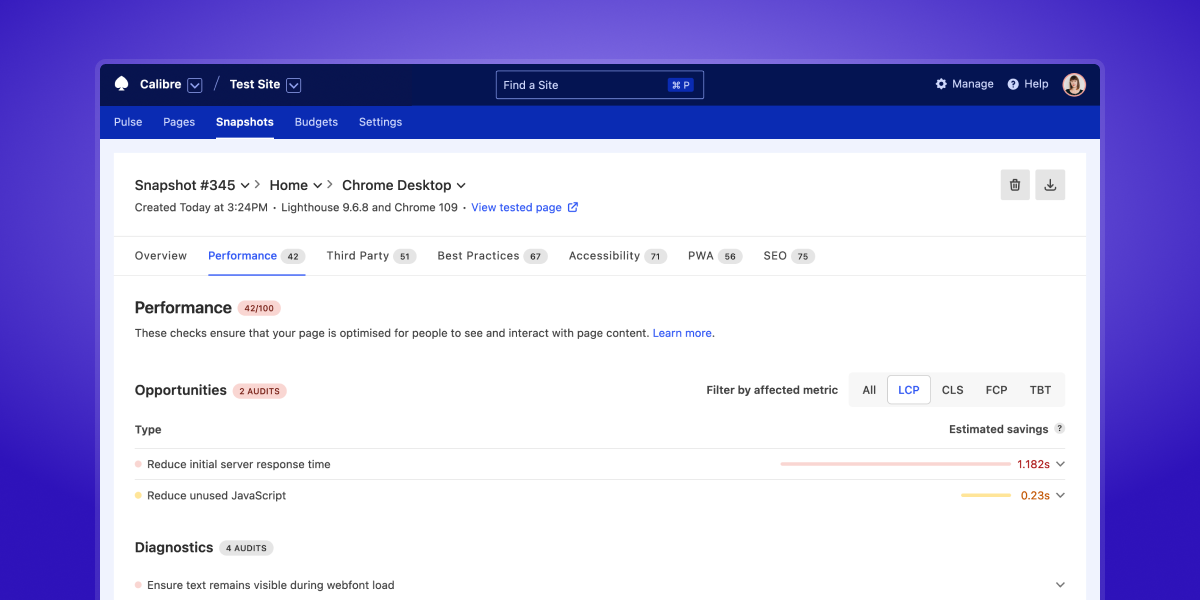
It’s now easier to prioritise which improvement possibilities to focus on based on Lighthouse audits. You can view the Opportunities and Diagnostics for all Lighthouse audit types (Performance, Accessibility, SEO, Best Practices and Progressive Web Apps) for each test.
For Performance audits, you can filter by Web Vitals metrics impacted by the audit and check the potential time and byte size savings you could observe by addressing specific advice given by Lighthouse.
Check out the refreshed audits by heading any selected Snapshot!