We refreshed the Third Party page, so you can quickly assess the impact of external tools and scripts on performance. The report visualises how first and third-party resources contribute to page transfer size and main thread execution time. You can also quickly pinpoint which category of tools is the most costly, whether it’s bandwidth or time.
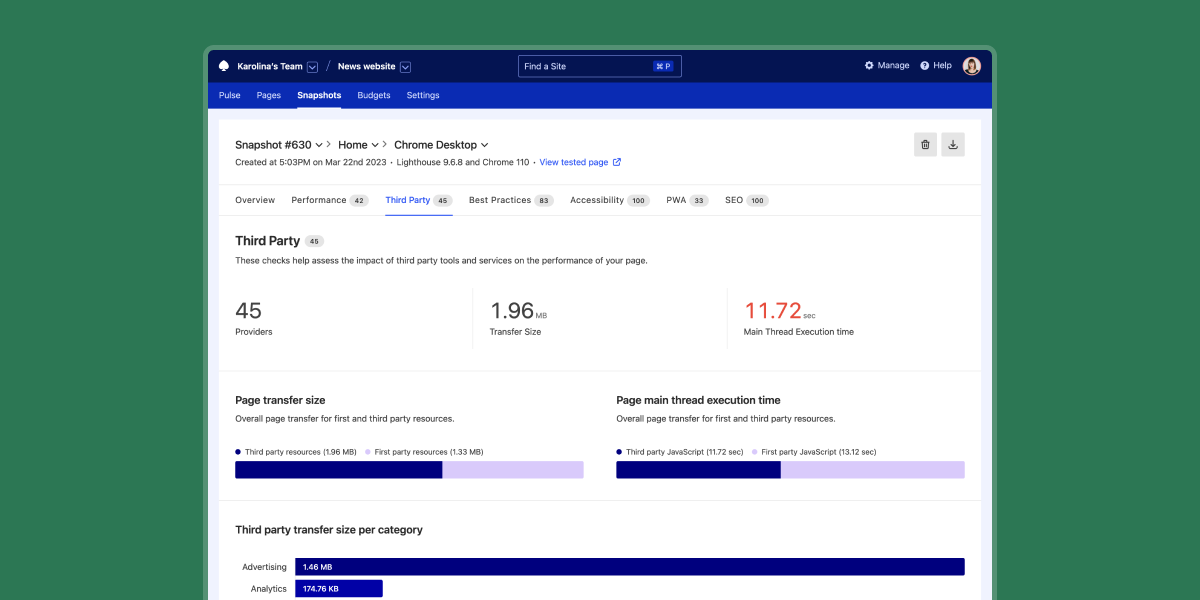
Soon, we’ll be adding more information about third-party requests, including details about file types. You can view the Third Party report by navigating to a Snapshot and clicking the Third Party tab.