
Working on web performance is a split between observing trends, and addressing issues through targeted profiling. Calibre’s Snapshot Overview (what we call a single test under specific test conditions, executed for a single page) was created to help find specific reasons for poor user experience, similarly to debugging someone might be performing in browser’s developer tools. Today, we released the new Snapshot Overview, which prioritises clarity of performance data and adds new capabilities in identifying where slowness is coming from.
We overhauled the Snapshot Overview with the following goals in mind:
- Make the Web Vitals data and assessment status easy to interpret, no matter anyone’s performance knowledge or role.
- Increase third-party request and JavaScript long task prominence, so it’s clear which services cause performance issues.
- Ensure it’s easy to understand why tests or authentication might fail, and how to fix errors.
Check Snapshot Overview, Audits and Third Party Report in action. No Calibre account needed.
Know the status of your Web Vitals assessment#
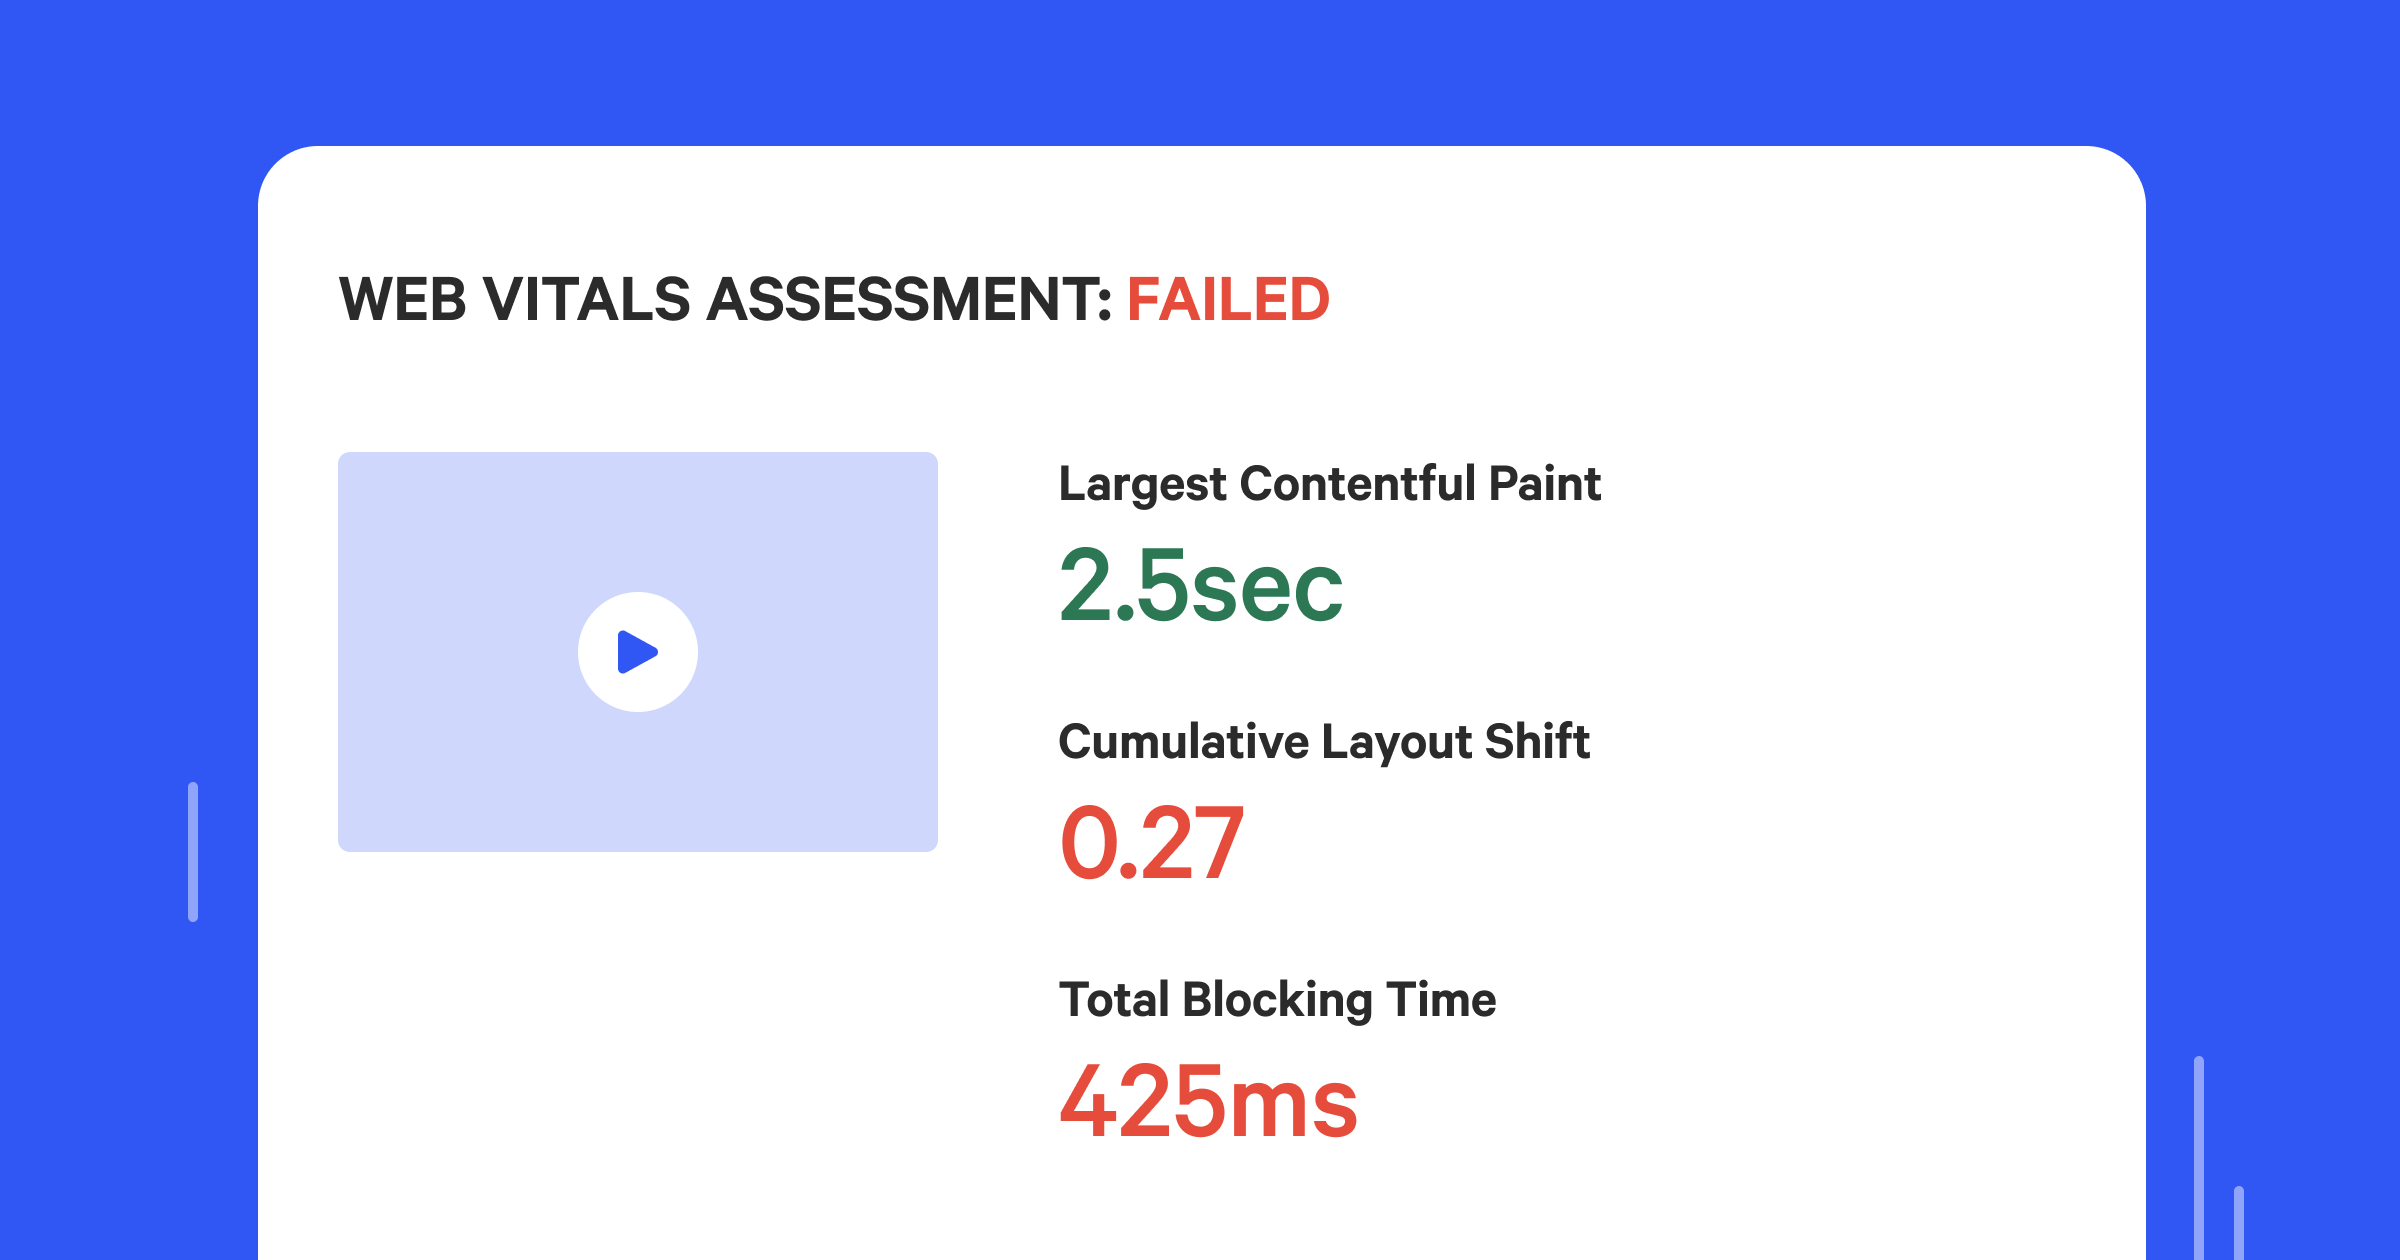
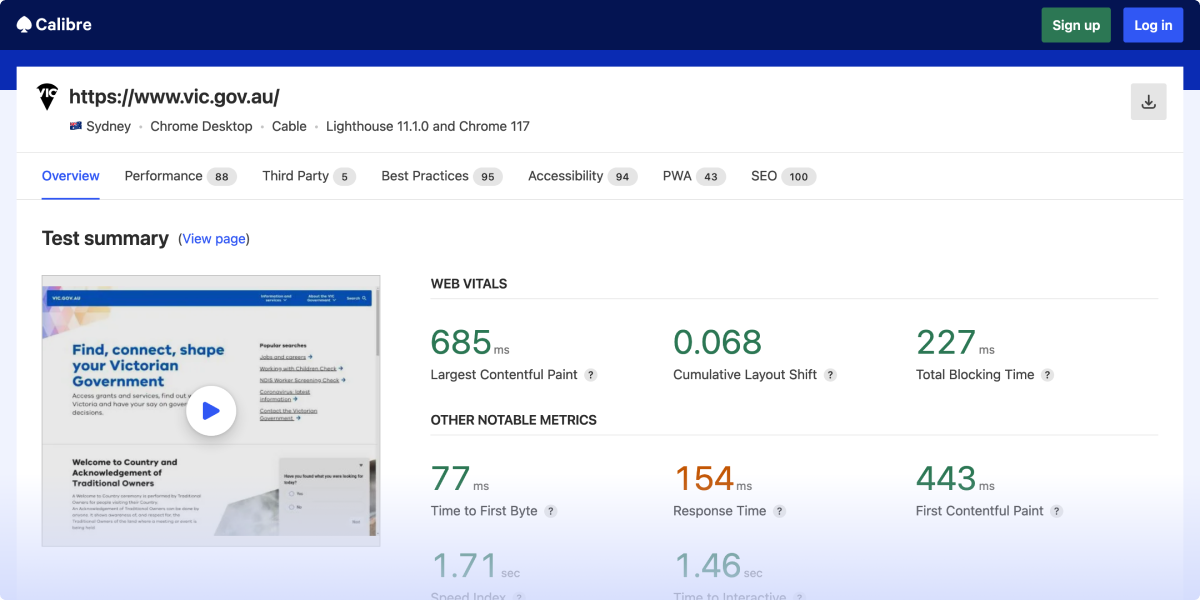
Many teams are looking to the Web Vitals metrics to assess and prioritise web performance work. In the top section of each Snapshot report, we now visually separate Web Vitals metrics (Cumulative Layout Shift, Total Blocking Time, and Largest Contentful Paint) along with the overall Web Vitals assessment status (passed, needs improvement or failed).
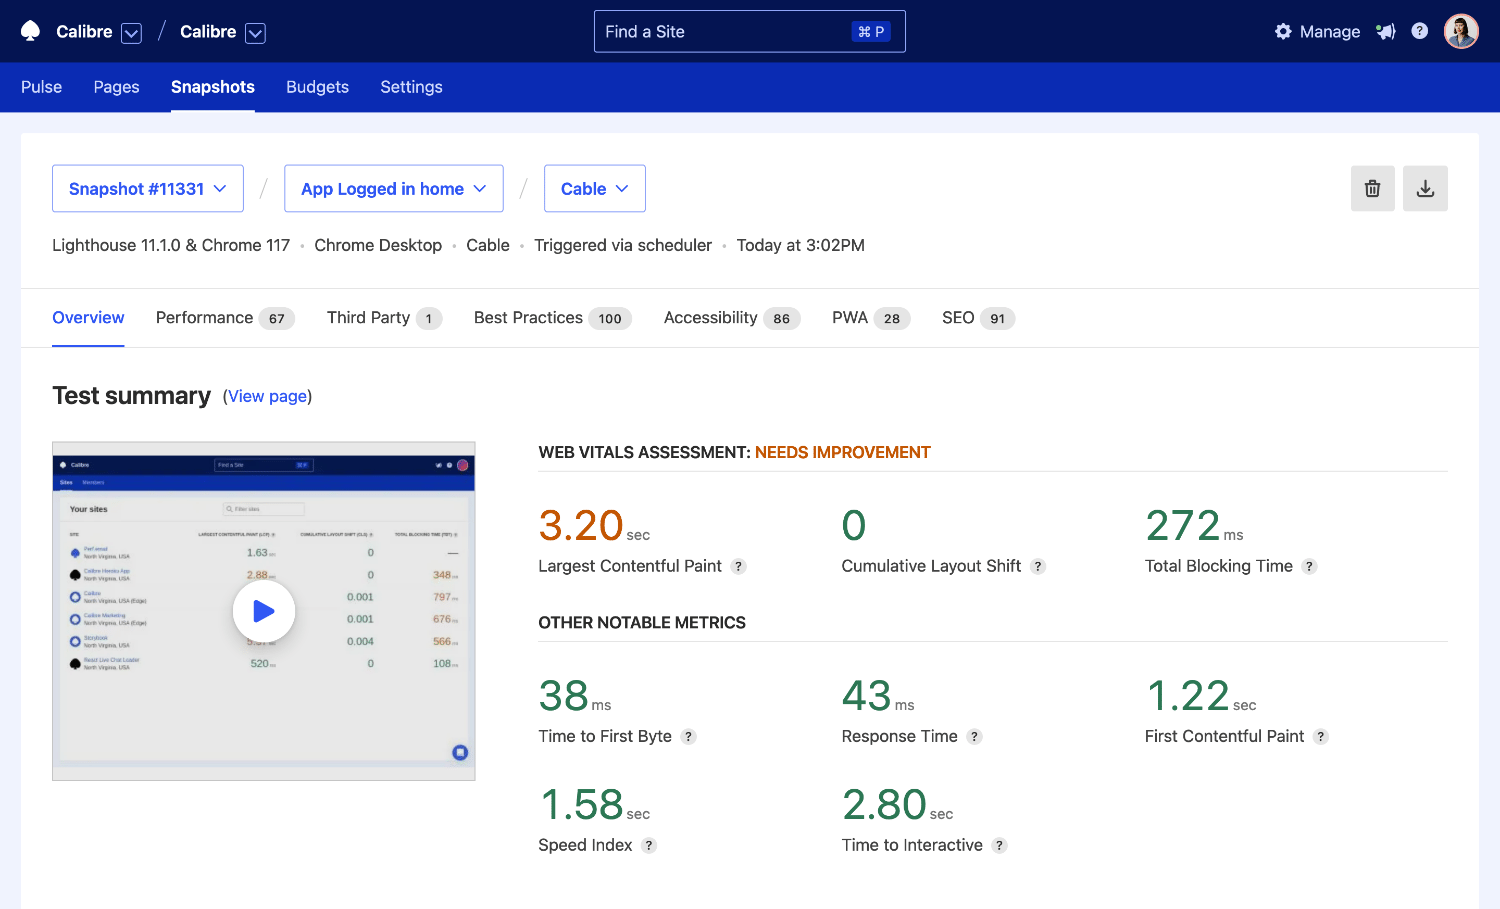
All measurements are graded accordingly to Google’s metric range recommendations (red for poor, amber for needs improvement, and green for good), so you’ll always know which ones need actioning.
Check the test and authentication history#
There is no denying that sometimes, Lighthouse performance tests can fail due to an error. Calibre now brings more visibility to the test progression history with a dedicated event log for each test.
The event log will list the test settings applied, which URL has been tested, and the server response code. This is helpful to confirm settings, but also potentially debug if a page becomes unavailable.
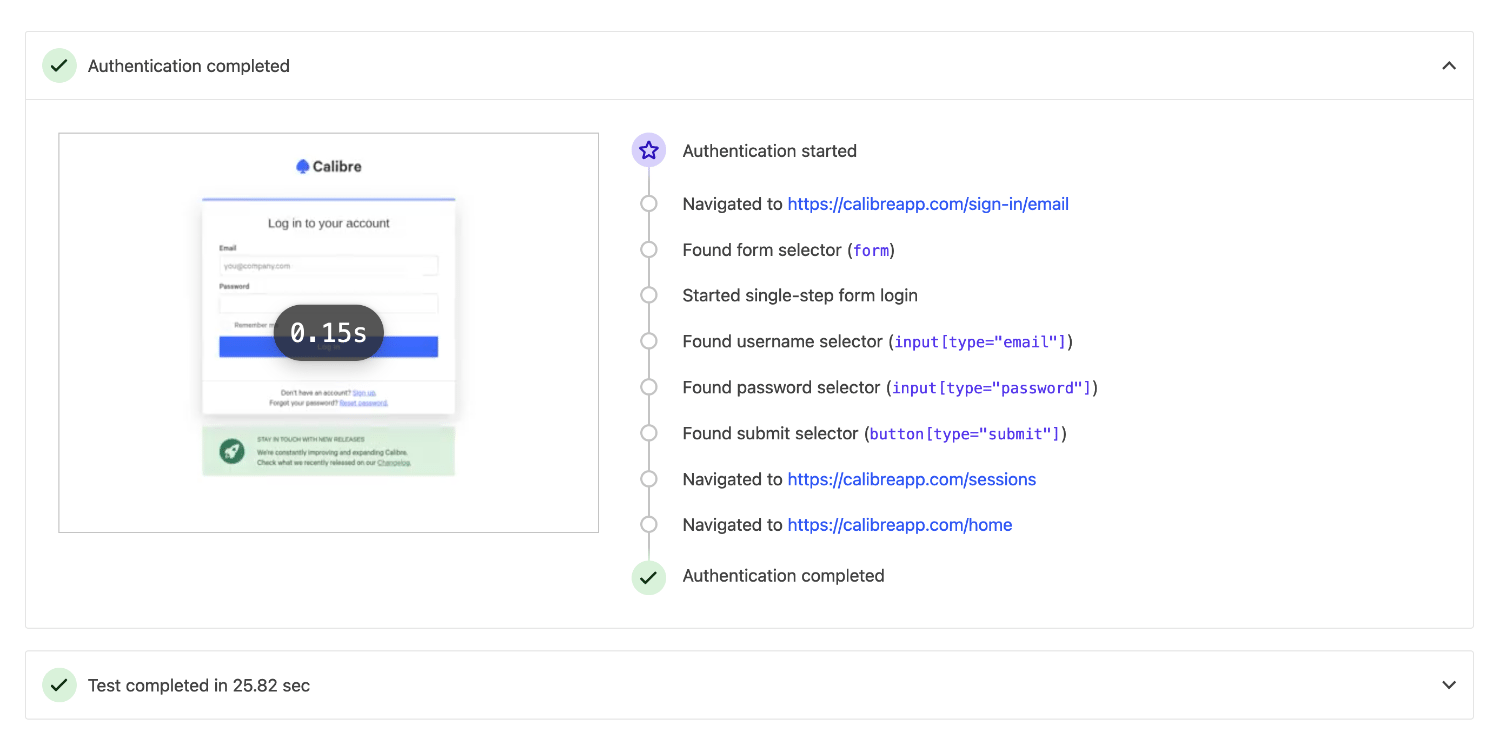
Additionally, if you are testing protected sites with form authentication, Calibre will show a log of finding specified form elements and whether authentication was successful.
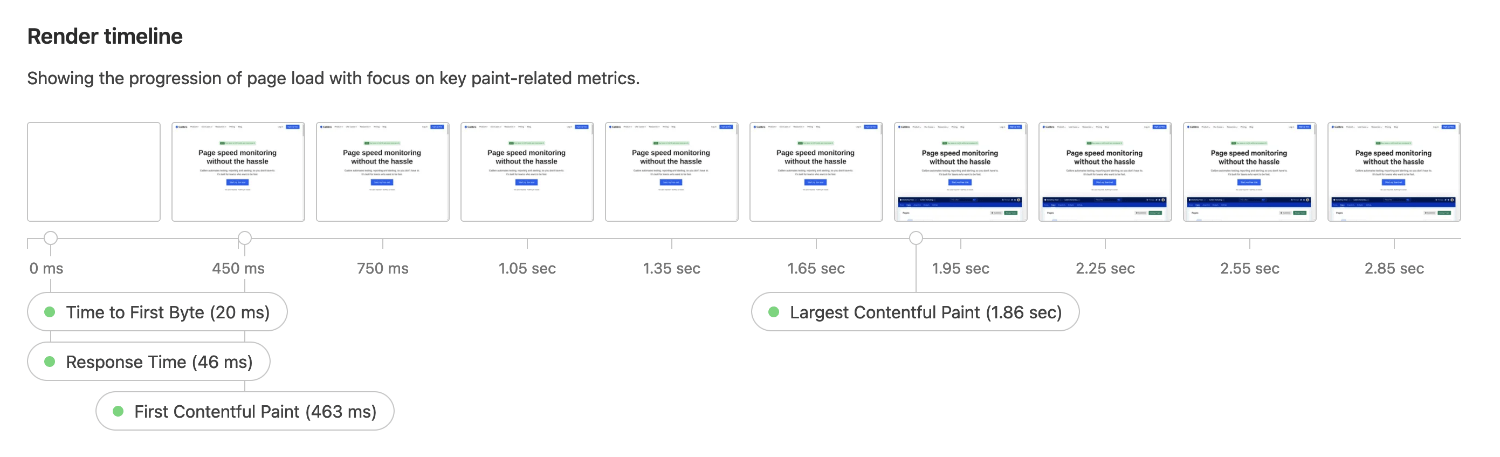
Correlate key paint metrics to the rendering process#
We added key metrics considering the paint process (Response Time, Time to First Byte, First Contentful Paint, and Largest Contentful Paint) to the render timeline, so it’s easy to correlate them to the progression of the page rendering process:
Find and address JavaScript long tasks#
Long JavaScript tasks can prevent the page from rendering and make it unresponsive, which is only an example of problems that can be caused by JavaScript. Previously named Main Thread Execution Timeline is now Long Task Timeline and portrays all long tasks, split by first and third party.
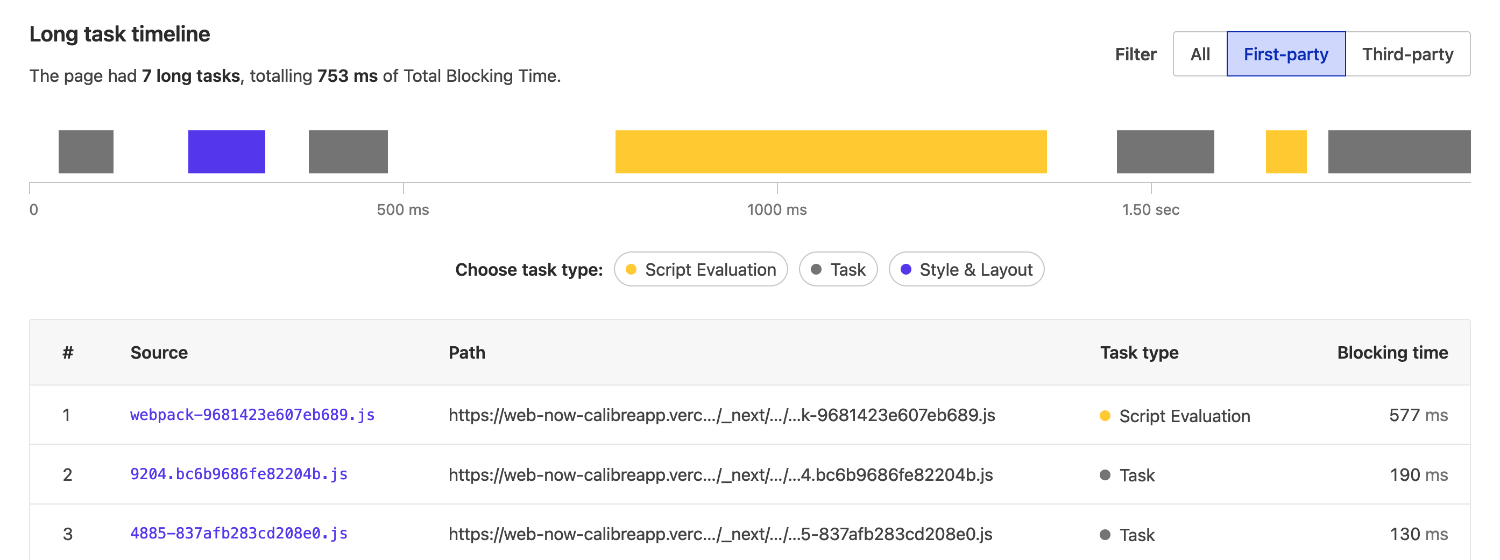
Your team can now easily find the longest tasks and attribute them to internal scripts or external services, and make appropriate decisions on how to remedy speed issues.
Investigate and optimise requests#
Loading critical assets as fast as possible is vital for fast sites. Whether your team has already adopted strategies such as critical requests or is managing requests with priority hints or looking to start, it’s important to be able to inspect requests in detail.
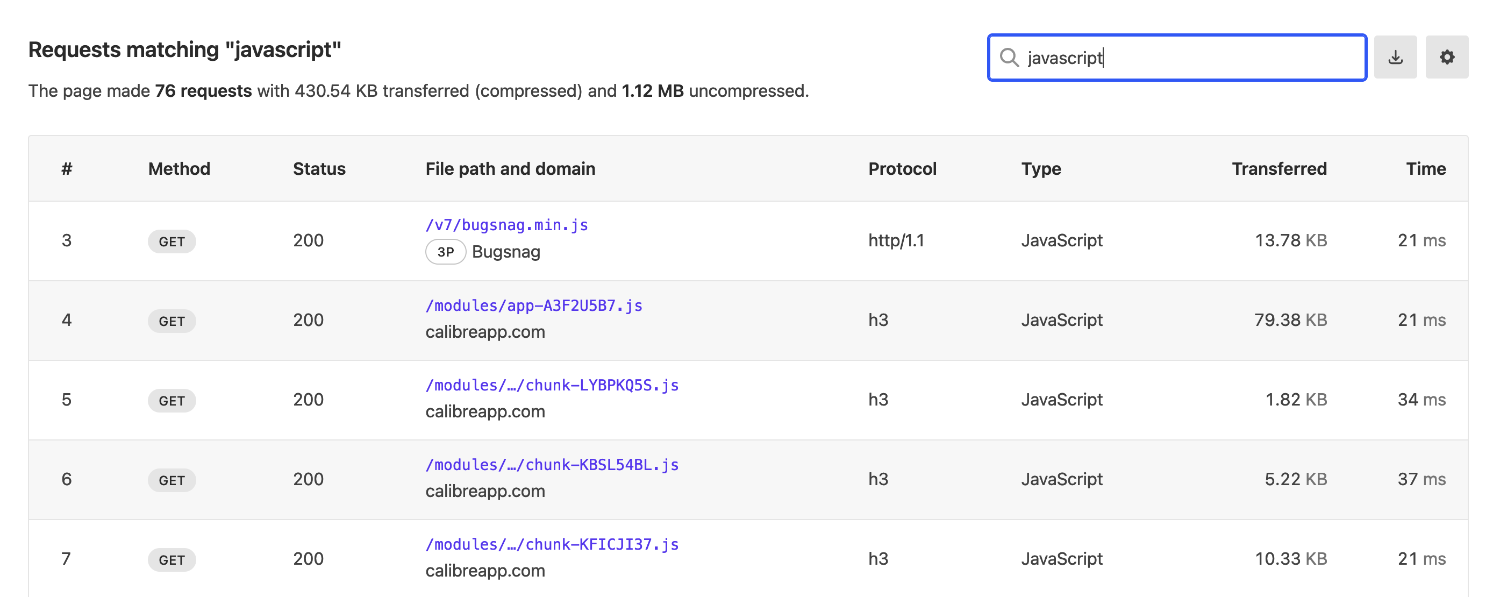
Now, you can customise the request table to only show the information that’s helpful to your current work, such as double-checking if assets have the right priorities or compression set. It’s also easy to find troublesome redirects or error status codes for resources.
If you’d like to find out more about Snapshot reports, here are a few helpful resources:
- Report: Snapshot Overview
- Report: Lighthouse Audits
- Report: Long Task Timeline
- Report: Third Party Tracking
If you’re new to Calibre, you can sign up for a free 15-day trial. Need more time? We’ll happily extend the trial period, too.