Use the new CrUX Metric Report to analyse Core Web Vitals metrics for your Sites in greater detail. The Metric Report provides a comprehensive view of all Chrome User Experience Report metrics. Now, you can:
- View up to 24 months of historical data
- See Largest Contentful Paint (LCP) subparts, which help you understand the timings that make up the metric and where you can make improvements
- Break down performance by device type (Desktop, Tablet, Mobile)
- List the top 5 slowest pages for each metric
- Check UX Rating accordingly to Core Web Vitals thresholds (Good, To Improve & Poor)
- Visualise Core Web Vitals thresholds directly on charts, and correlate your data to recommended values
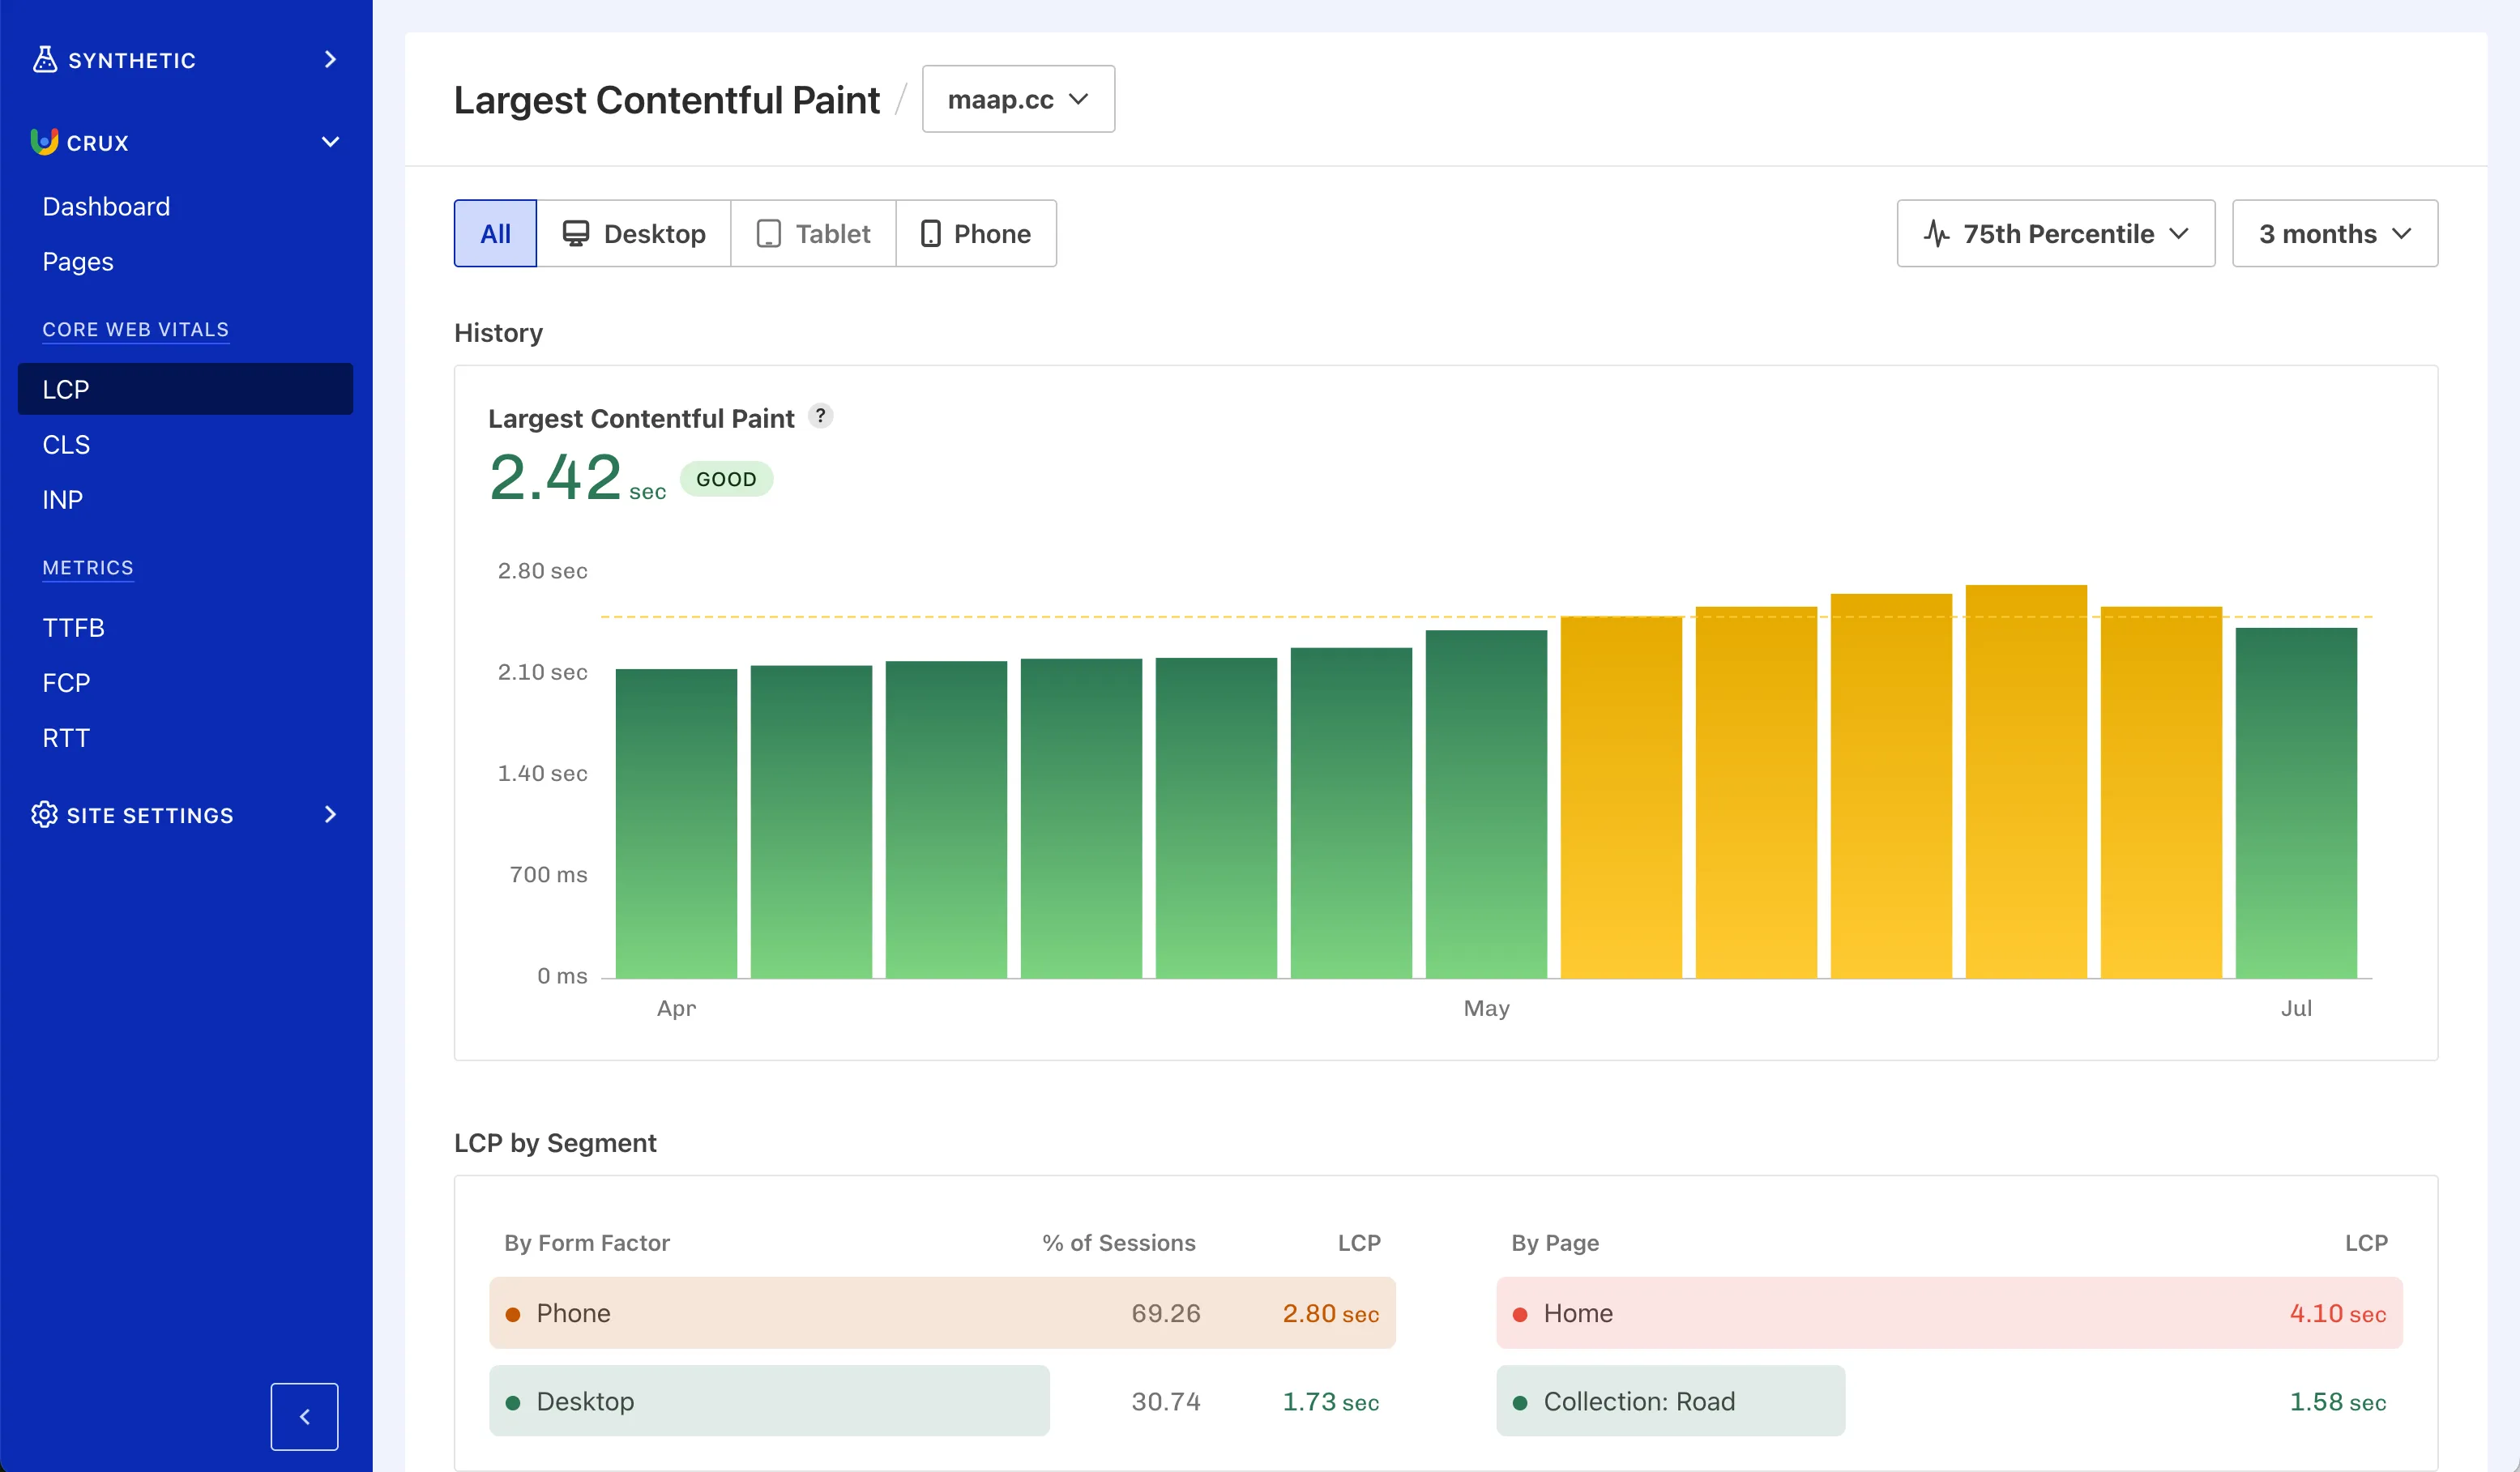
Screenshot: CrUX Largest Contentful Paint Dashboard.
Largest Contentful Paint Subparts#
Chrome User Experience Report (CrUX) provides "subparts" for LCP. Subparts break down the Largest Contentful Paint metric into its components. This helps you understand what contributes to your LCP measurements, allowing you to optimise performance in a targeted way.
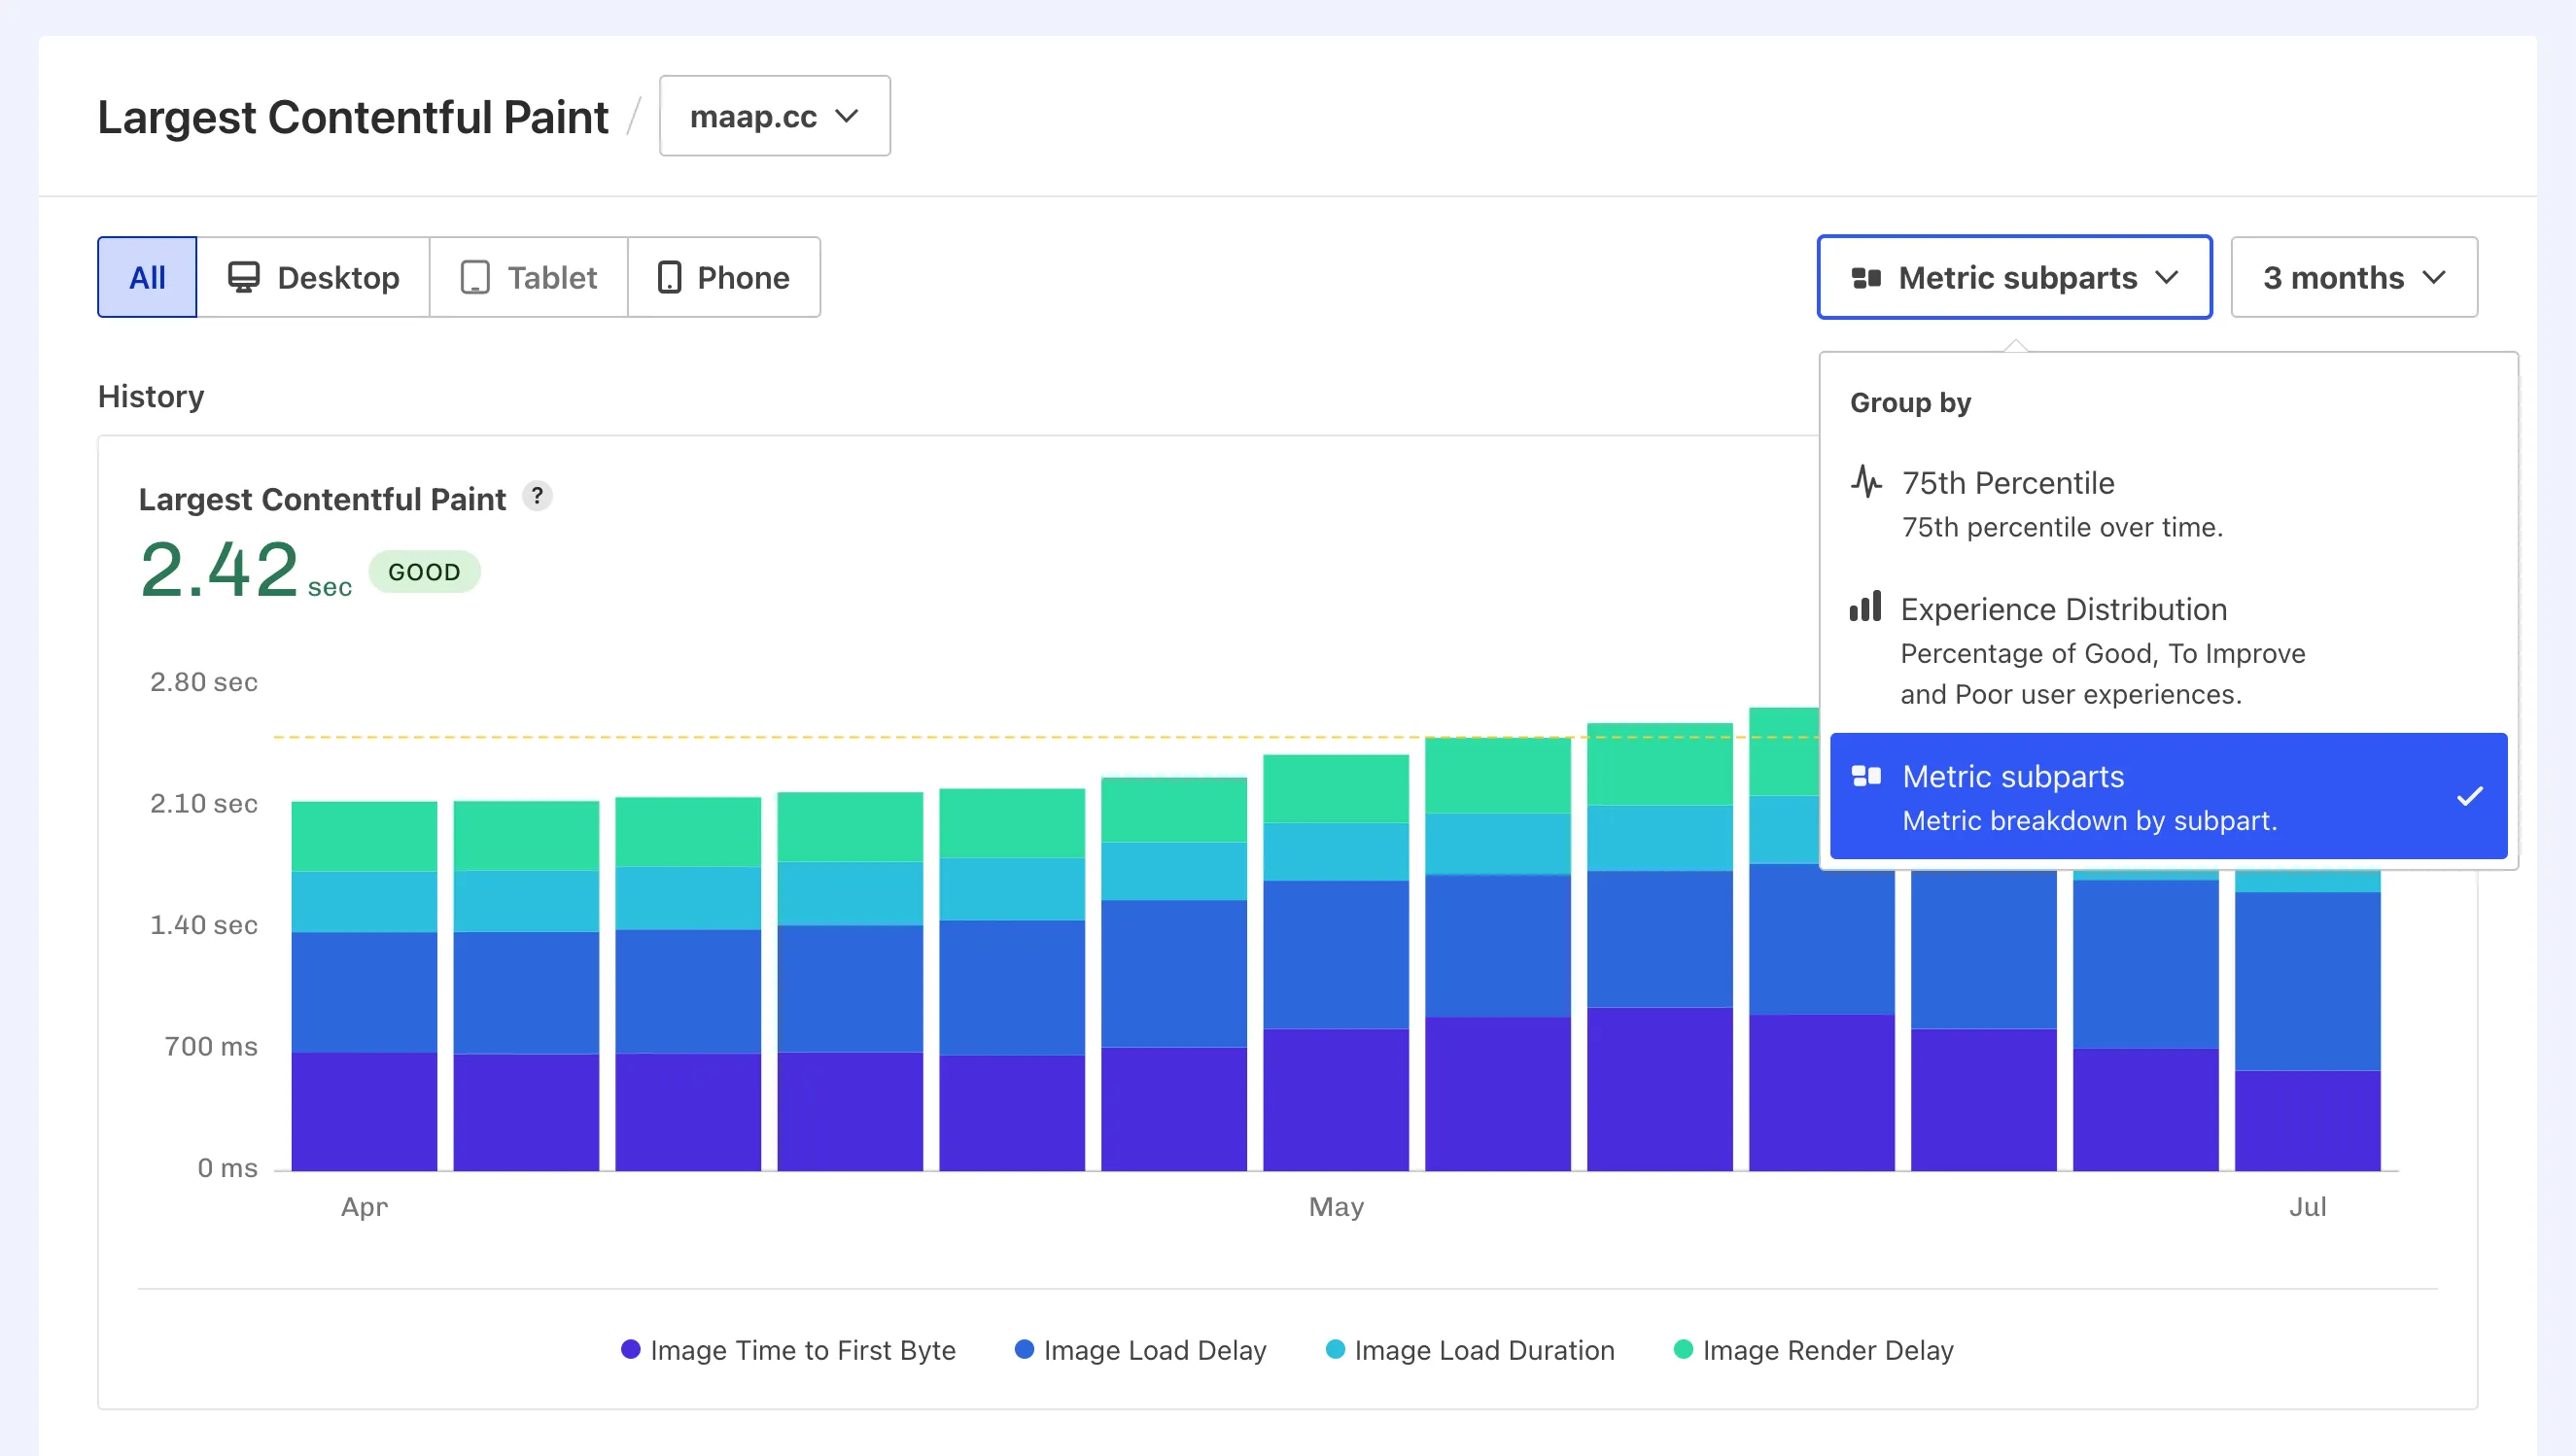
Screenshot: Largest Contentful Paint Subparts show the individual elements that contribute to the LCP measurement.
The new Metric Report is available for all Sites tracked in Calibre. You can access it from the CrUX Dashboard, or directly from the sidebar navigation.
At the moment, Google only provides subparts for LCP, but we expect to see subparts for other Core Web Vitals metrics in the future.