
We summarise what we released in 2020: new features, product improvements and upcoming releases.
New features#
Pull Request Reviews: avoid releasing speed regressions#
In January, we released Pull Request Reviews, a GitHub integration that allows you to receive performance audits directly in your Pull Requests. With Pull Request Reviews, you can see your development work’s impact as it happens and avoid releasing code that hurts speed.
Performance must be at the front of our minds in the entire feature build and planning process instead of being assessed at the very end. Auditing speed post-release inevitably will bring more engineering work and uncover regressions in user experience.
Learn how to enable Pull Request Reviews for your Sites.
Long Task Timeline: audit and improve runtime performance#
JavaScript is one of the top reasons for poor performance and user experience. That’s why in May we released Long Task Timeline which helps you to visualise the JavaScript main thread performance and identify blocking tasks.
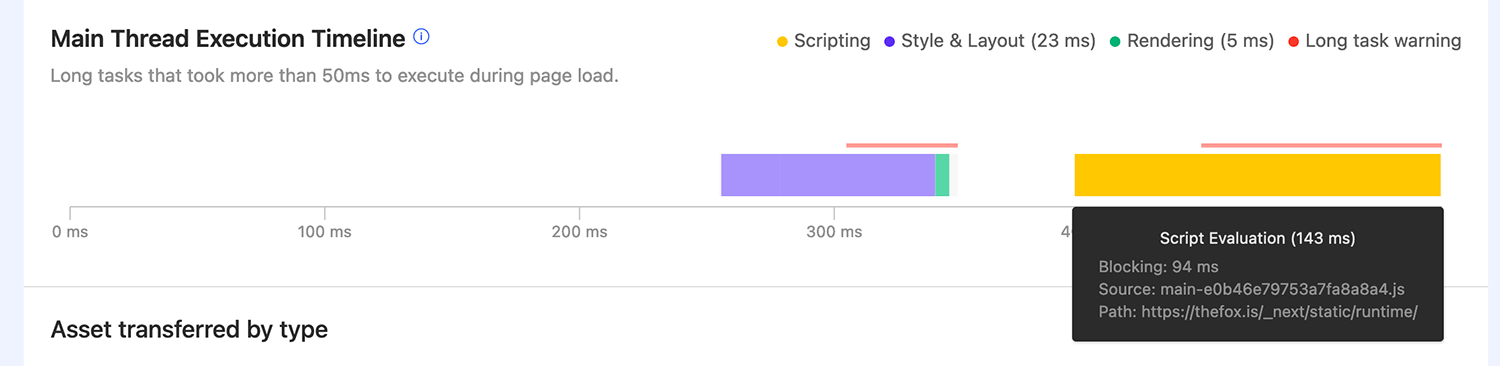
A busy JavaScript main thread will significantly impact a range of interactivity and paint metrics, also affecting your Performance Score. Runtime performance should be a priority, especially for JavaScript-heavy apps and sites.
Know how to interpret JavaScript performance with Long Task Timeline.
Budgets 2.0: set and meet speed goals#
It’s challenging to be across the desired values for all performance metrics. It’s also difficult to succeed without tangible goals. In June, we completely overhauled Performance Budgets. Now, you know where your metrics should be, track your progress and be notified when you meet or break your goals.
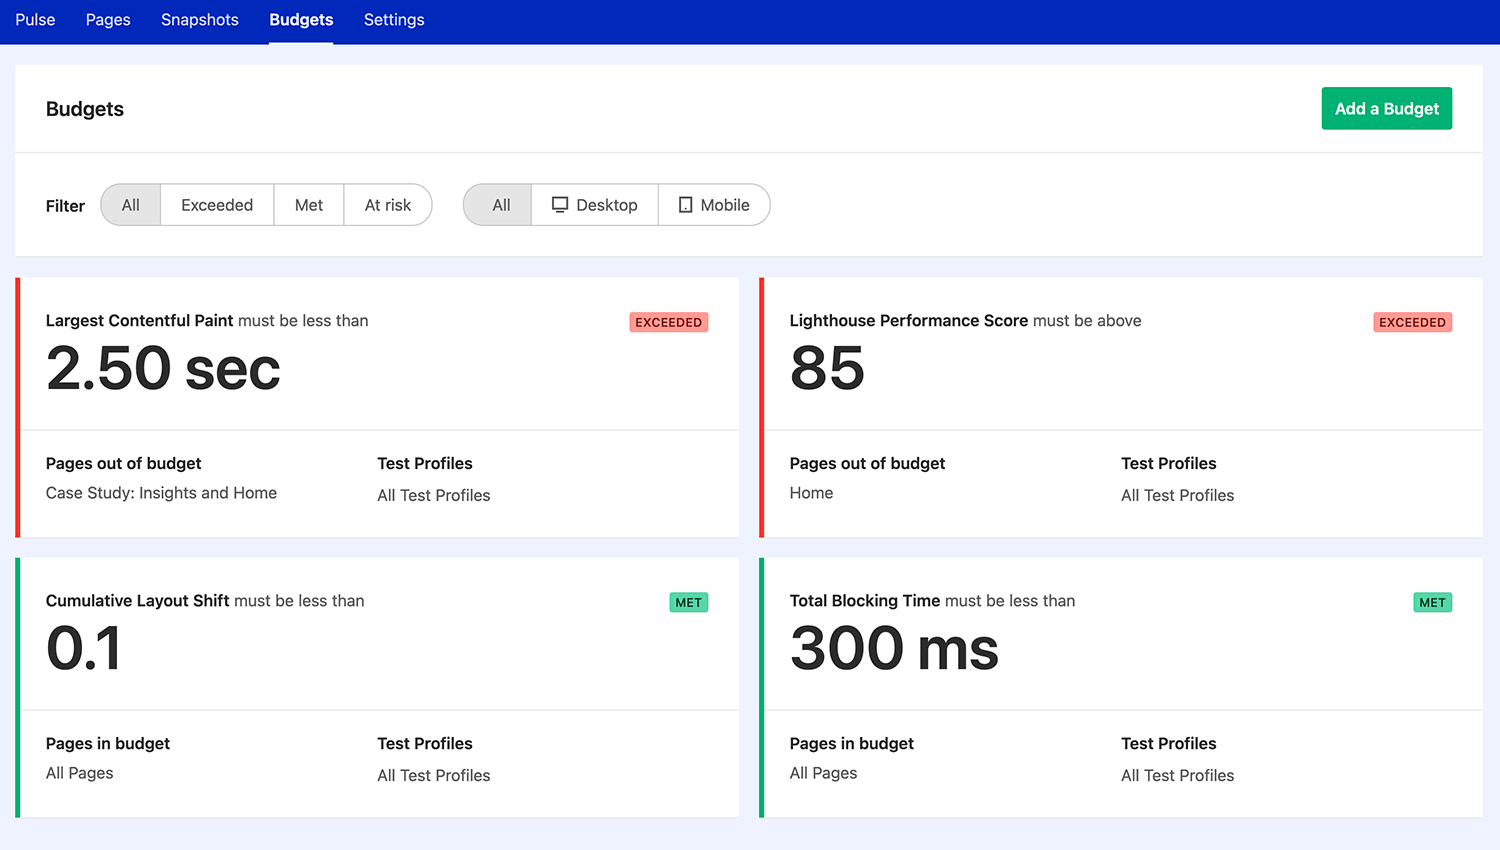
With Budgets, you are introducing accountability and specific goals that can be monitored over time. Calibre will recommend metric ranges for good user experience and send emails or Slack alerts when your thresholds are met or blown.
Learn how to create and manage Performance Budgets.
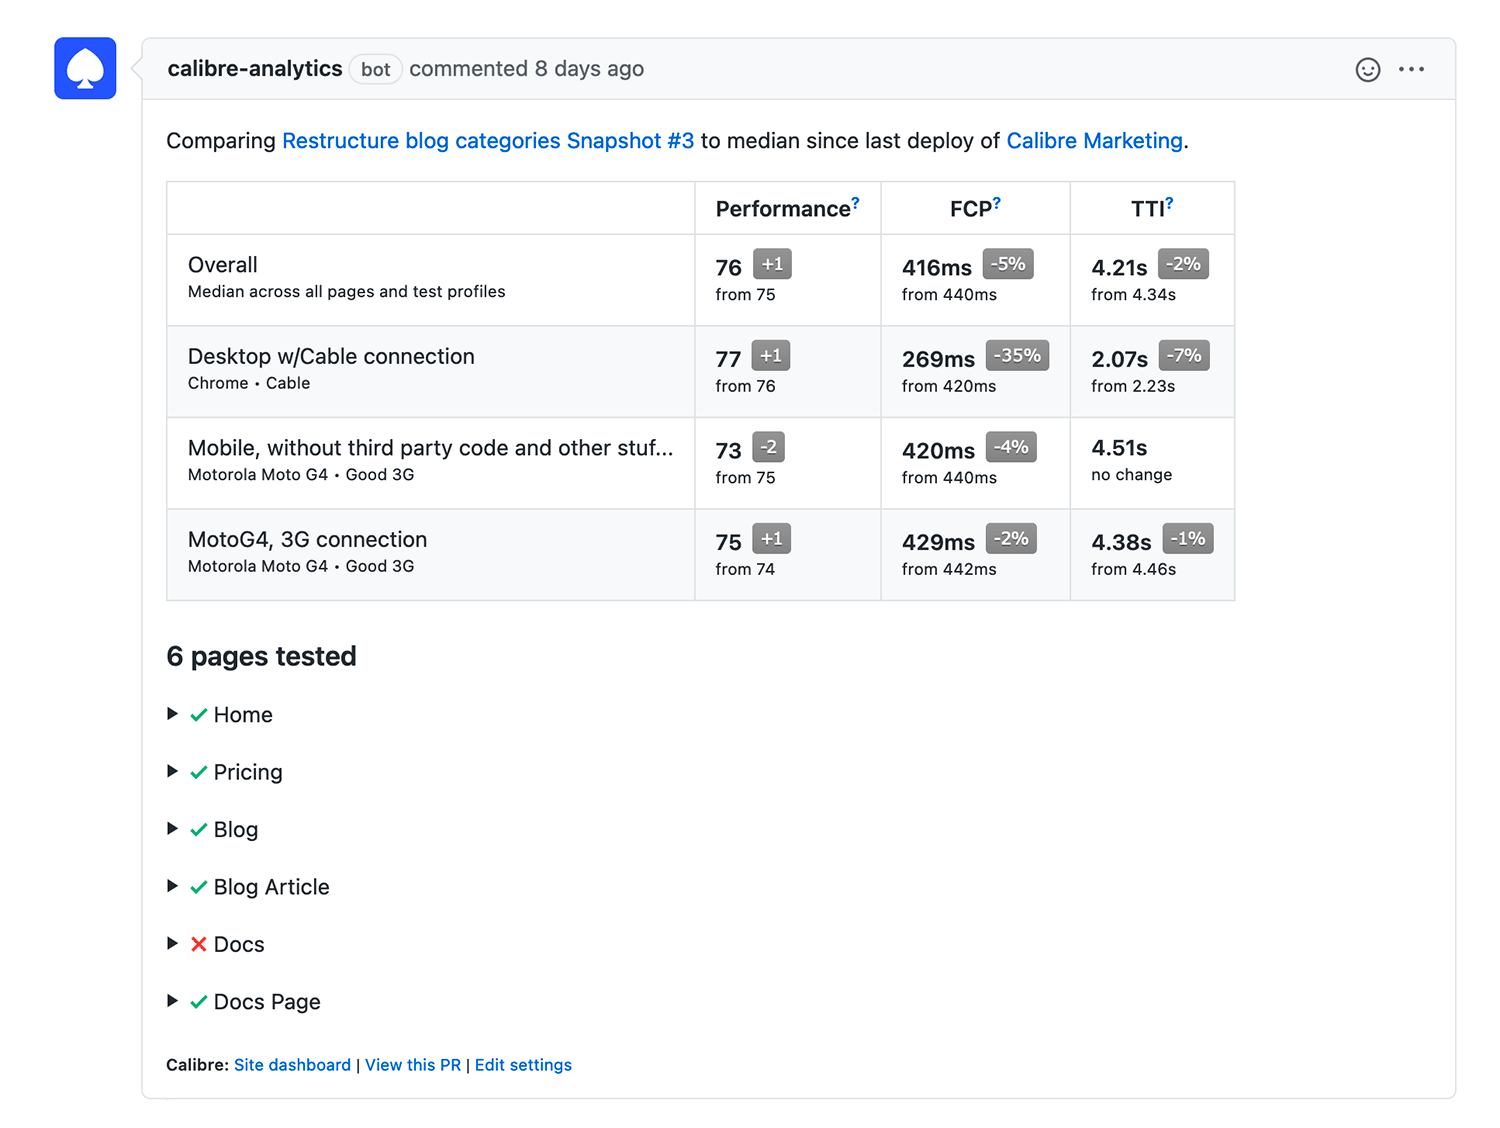
Pages Leaderboard: find your fastest and slowest Pages#
Sites and applications can comprise hundreds of unique pages, which is why it’s not easy to evaluate their performance. In August, we made Pages Leaderboard public, so you can benchmark your pages based on devices and selected metrics.
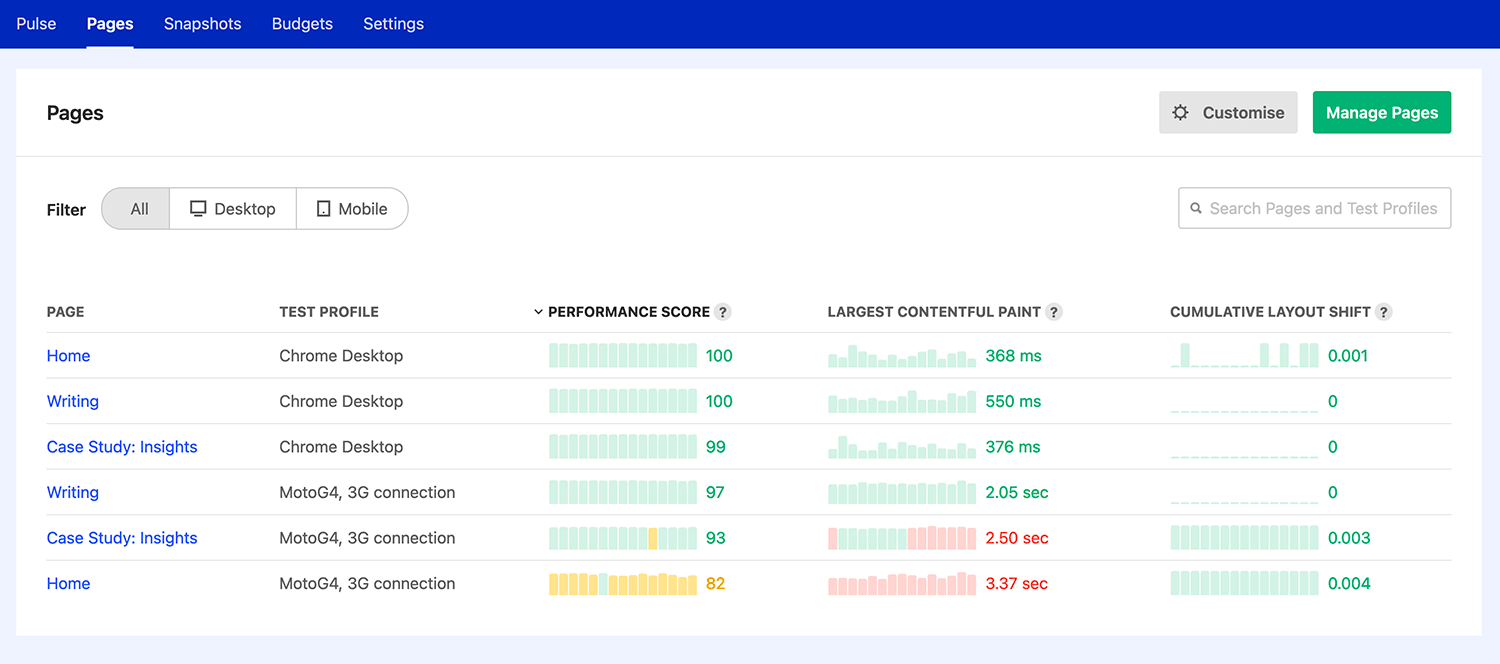
The conversions might be lower because critical pages don’t meet performance baselines for a good experience. Pages Leaderboard will uncover areas you should be focusing on depending on your KPI metrics (for example, Web Vitals).
Learn how to view and set up your Pages Leaderboard.
Existing interfaces: refreshes and improvements#
In 2020, we redesigned and rebuilt several existing parts of Calibre with usability and experience enhancements in mind. What before might have been slightly wonky or not easy to use or find, is now more transparent and seamless:
- Billing area: in February, we released new Billing management area, to ensure managing your plan, test usage, payment information, and receipts is easy:

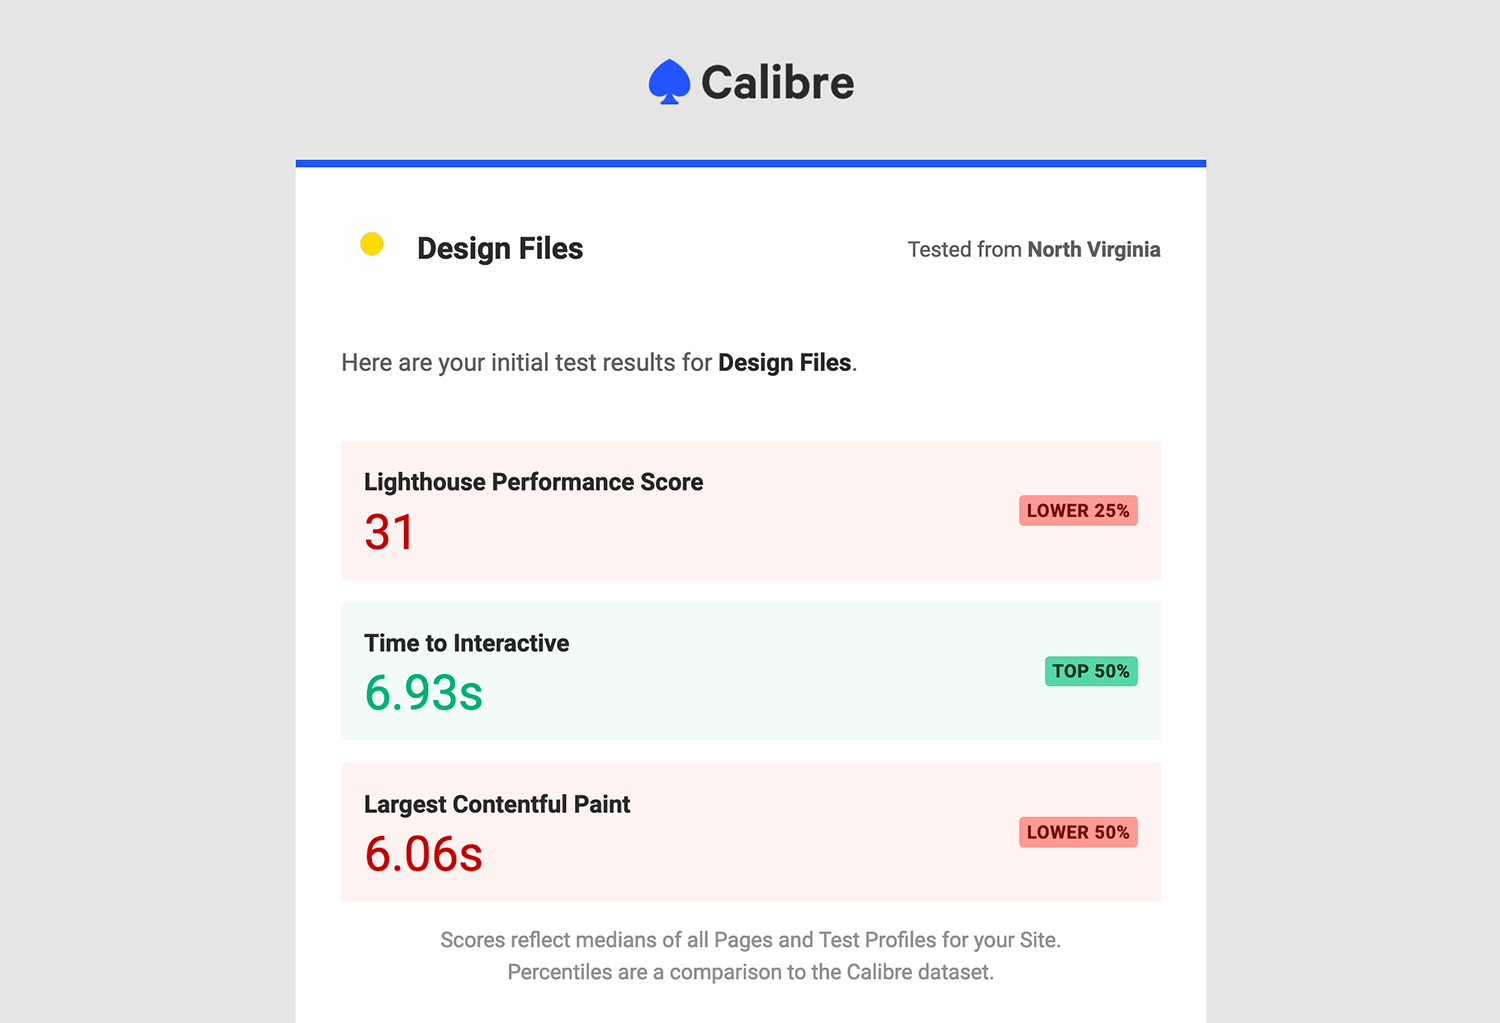
- First results email: in March, we added three critical performance metrics (Performance Score, Time to Interactive and Largest Contentful Paint) to the first email you receive after your Site is tested, so you can see how it fares against the Calibre’s dataset:
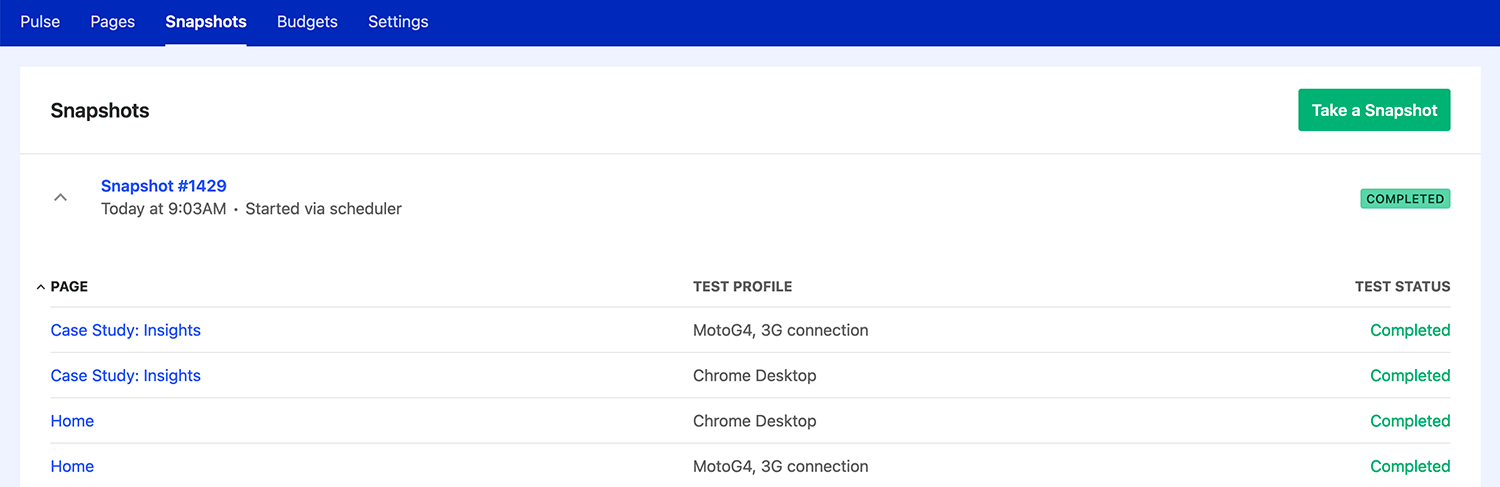
- Snapshots page: in April we refreshed the Snapshots list to clearly show the status of your performance tests:
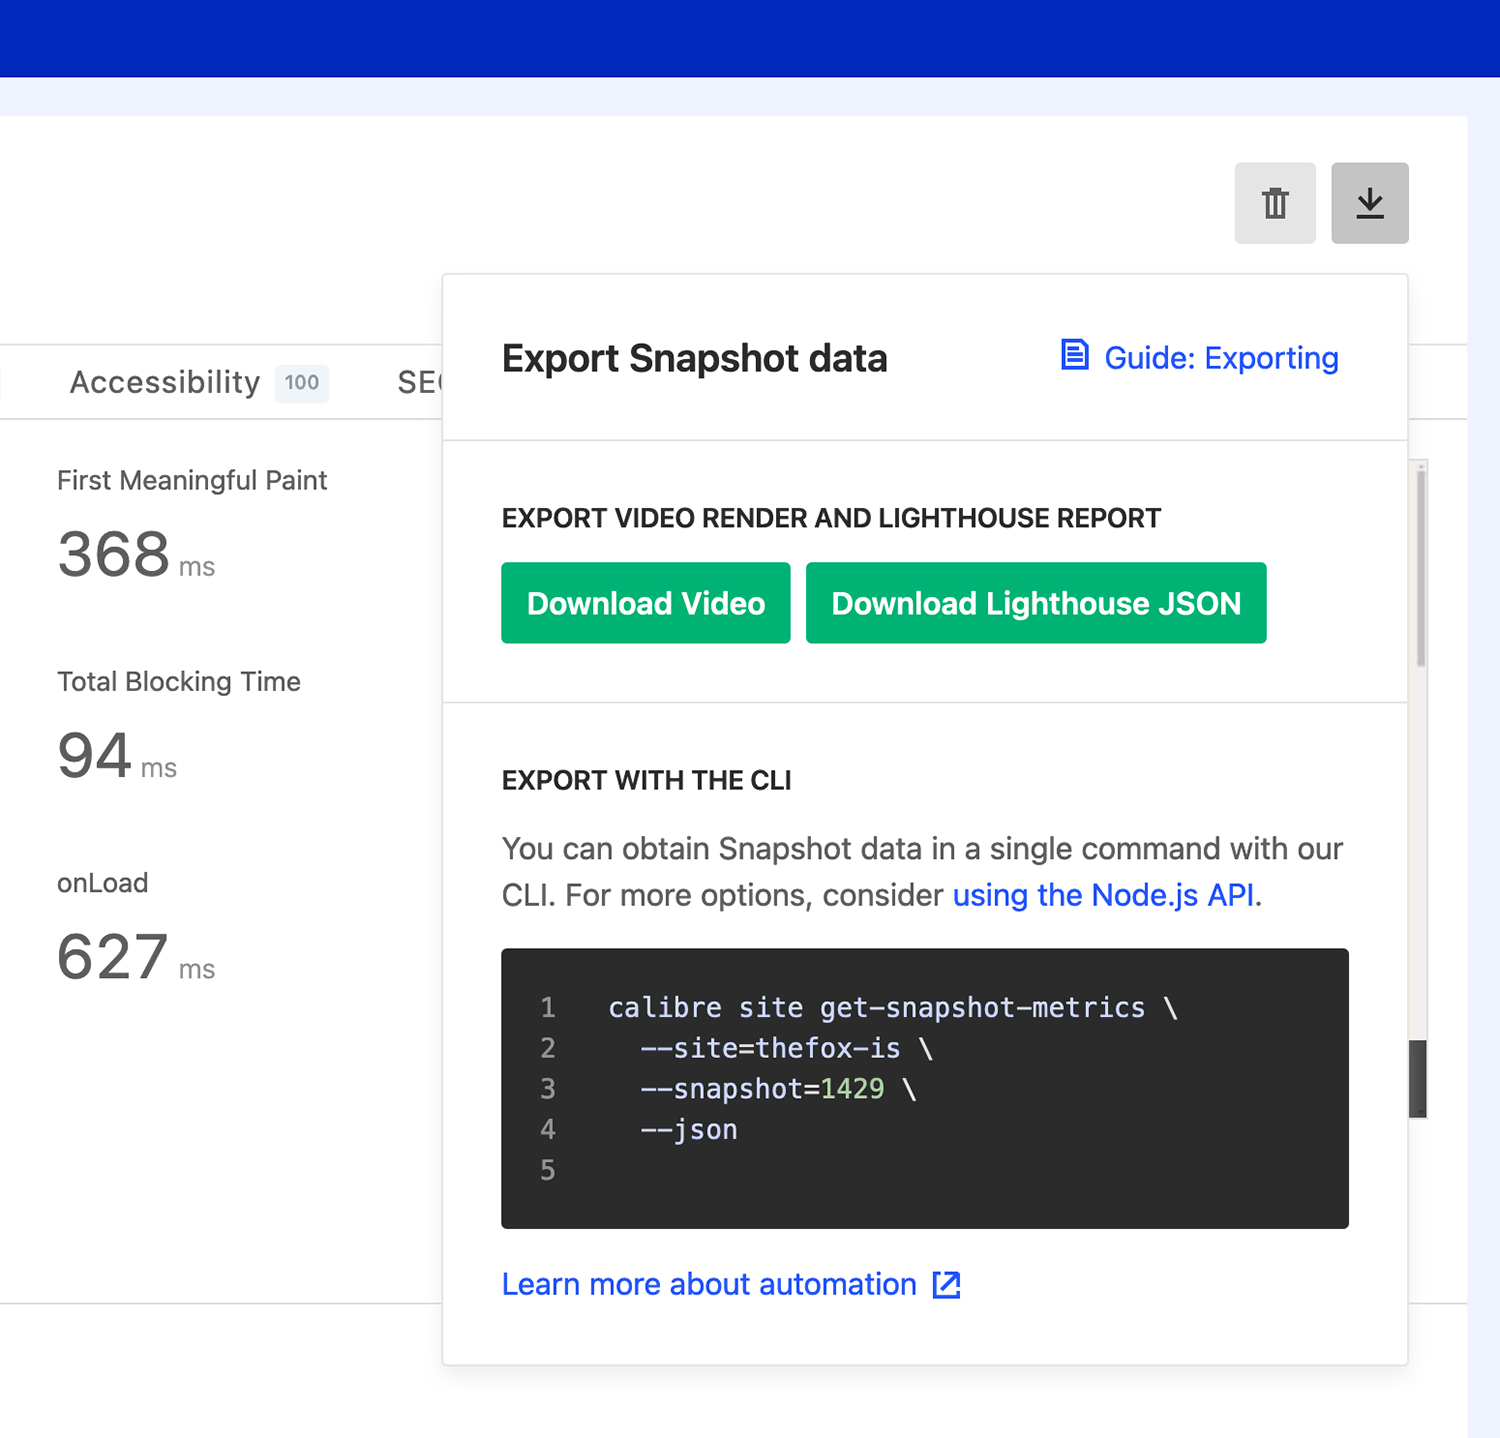
- Export widget: in September, we revamped the Export widget, so you can easily choose between direct downloads and copy-able snippets of commands for our CLI:
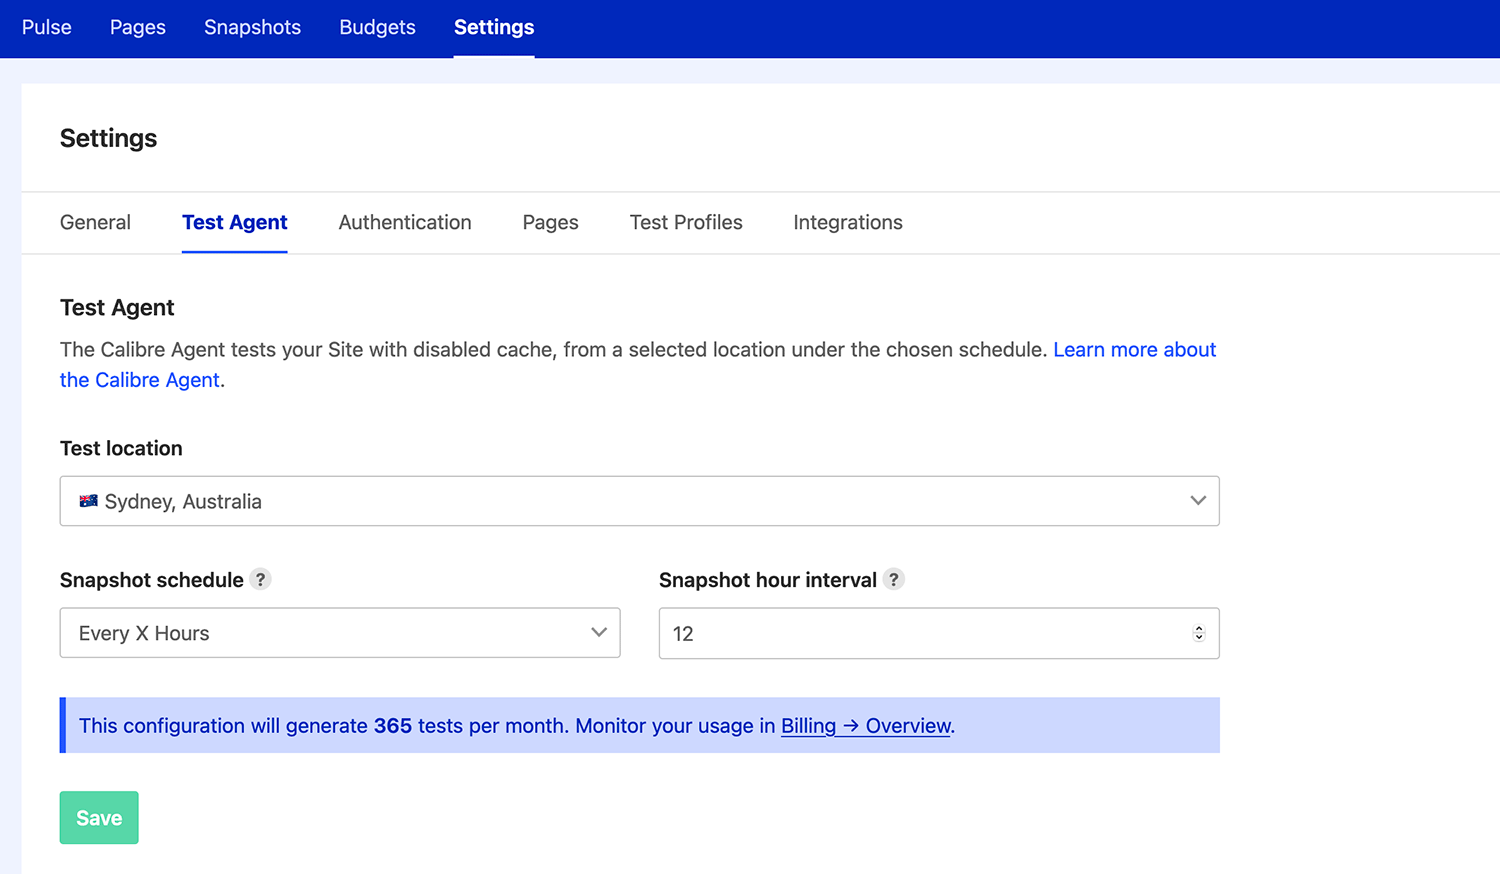
- Site Settings area: in October, we rebuilt the Site Settings, so you can better manage how your Sites are tested and explore integrations:
New metrics: Max Potential Input Delay and Cumulative Layout Shift#
Within the last few years, several new performance metrics have been created to help understand different aspects of user experience. In 2020, we introduced the following, new metrics to Calibre:
- Cumulative Layout Shift: a paint metric portraying the sum of scores from all of the unstable elements that move around during page load.
- Largest Contentful Paint: a metric portraying time the largest image, video or text element was painted to the screen.
- Total Blocking Time: the total duration of Main thread tasks observed between First Contentful Paint and Time to Interactive.
- Max Potential First Input Delay: a runtime metric portraying the duration of the worst-case scenario time taken to respond to user interaction. Max FID is an equivalent of First Input Delay collected by Chrome User Experience Report and Real User Monitoring tools.
The first three metrics, CLS, LCP and TBT, are Web Vitals—critical signals portraying your sites’ quality of user experience.
Deprecated metrics: onDomContentloaded, onLoad, First Meaningful Paint and Visually Complete 85%#
In some cases, performance metrics are replaced with newer alternatives because they prove inaccurate. We closely monitor the development and reliability of metrics to ensure what Calibre reports can be depended on.
In 2020, we marked four metrics, onDomContentloaded, onLoad, First Meaningful Paint and Visually Complete 85% as deprecated, which means we don’t recommend tracking or setting goals against them. The monitoring data is still available for historical reasons.
Lighthouse: from 5 to 6.5#
Our speed testing suite’s critical component is Lighthouse—an open-source tool for improving the quality of websites and apps.
We regularly test and release new Lighthouse versions. In 2020, Calibre’s Test Agents ran on five Lighthouse versions (between 6.0 to 6.5) to bring you the most up-to-date testing suite. This included an upgrade from Lighthouse 5 to 6, which brought significant changes to the Performance Score algorithm and new audits.
Soon, we will run our tests on the latest major version—Lighthouse 7.
Automation: CLI and Node.js API improvements#
We built the CLI and the Node.js API to enable developers to not only retrieve and manage performance monitoring data but also build powerful integrations.
This past year, we released a major version of the CLI (3.0), that included the ability to manage API access tokens, Agent Settings as well as testing schedule and intervals when creating new Sites. We also released several minor versions with fixes and smaller improvements.
We continue being committed to developing Calibre’s extensibility through the APIs so you can use the monitoring data in any way that suits your needs.
Open Source: Image Actions 2.0 and more support for React Live Chat Loader#
We continued to develop and support our open source projects. We introduced numerous new features to Image Actions, our Github Action that automatically compresses JPEGs, PNGs and WebPs in Pull Requests. You can now see a visual comparison before and after compression, run optimisations on a schedule, and create complex workflows with the compressOnly option.
Interface facades gained traction as an effective strategy for improving performance. React Live Chat Loader, our React widget for mitigating the negative impact of chat tools, now supports Drift and Facebook Messenger. If you’re using live chat tools, consider trying React Live Chat Loader to improve speed.
We will continue developing these (and new) tools to help developers build a faster and more accessible web.
What’s coming in 2021?#
This year, we are already committed to building several features that will improve team collaboration, sharing reports and customising Calibre to what’s critical to you and your context.
We already shared a preview of Teams, which will allow granular control of people and their access to Calibre. With Teams, you will also be able to assign Sites to Teams so that you can divide your agency or other large organisations into discreet groups focusing on specific areas of work. After the initial Teams release, we will continue expanding its capabilities.
Another area we’re going to be updating relatively soon is the Pulse view. The new Pulse will become your command centre and a high-level overview of where your Site is at. You will be able to control what’s most critical to display for you, customise metrics, timeframes and devices. We will also be overhauling our charting to provide more visualisation options.
As always, we encourage sharing your feedback and thoughts about how we can improve Calibre for your organisation. The tools we build are a combination of a direct response to customer needs and industry expertise. We are committed to making performance more approachable to non-developer audiences and providing actionable insights to otherwise a complex subject. Anyone and everyone should feel empowered to understand and improve their web performance.
Onwards!