
We summarise what we released in 2023: new features, improvements and give a sneak-peek of upcoming releases.
New features#
Test with PageSpeed Insights presets#
Synthetic test settings have a direct correlation to reported results. By default, Calibre always applied device and simulation throttling at the time of the test, which is different to how PageSpeed Insights works. If your team relies on PageSpeed Insights, you can test continuously in Calibre using simulated throttling mimicking PageSpeed.
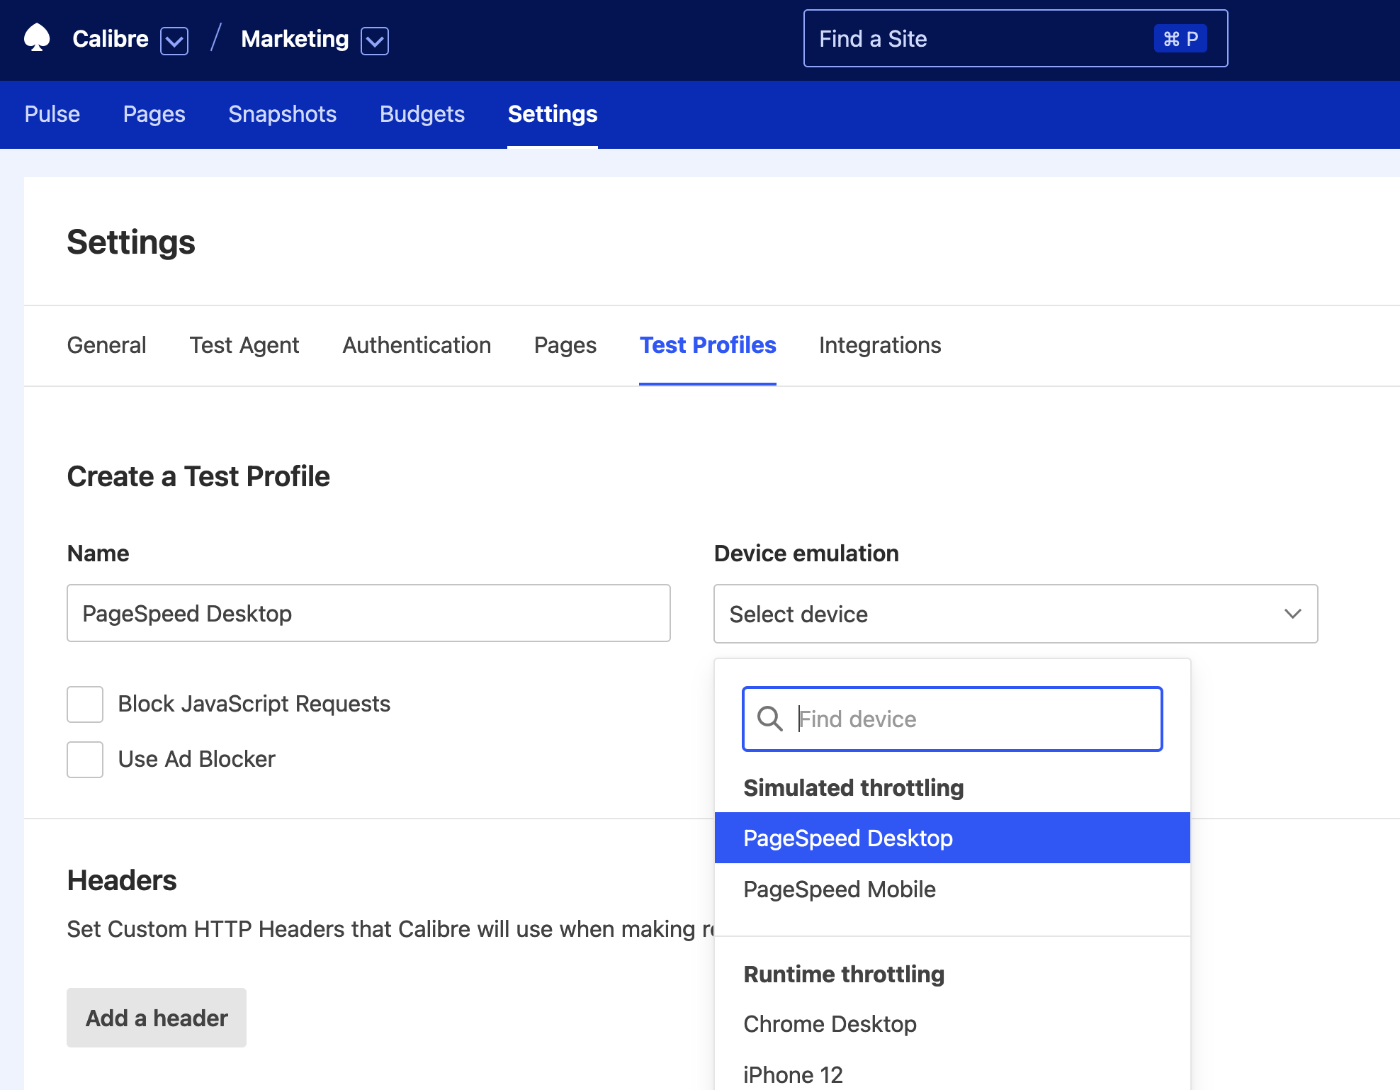
To test with simulated throttling, create a new Test Profile or update an existing one to use PageSpeed Desktop or PageSpeed Mobile presets.
Snapshot Overview: check Web Vitals assessment and easily debug tests#
Debugging a specific performance change is as important as observing trends. That’s why the Snapshot Overview (our report detailing a singular test) has gotten a fresh coat of paint and a handful of new features in November.
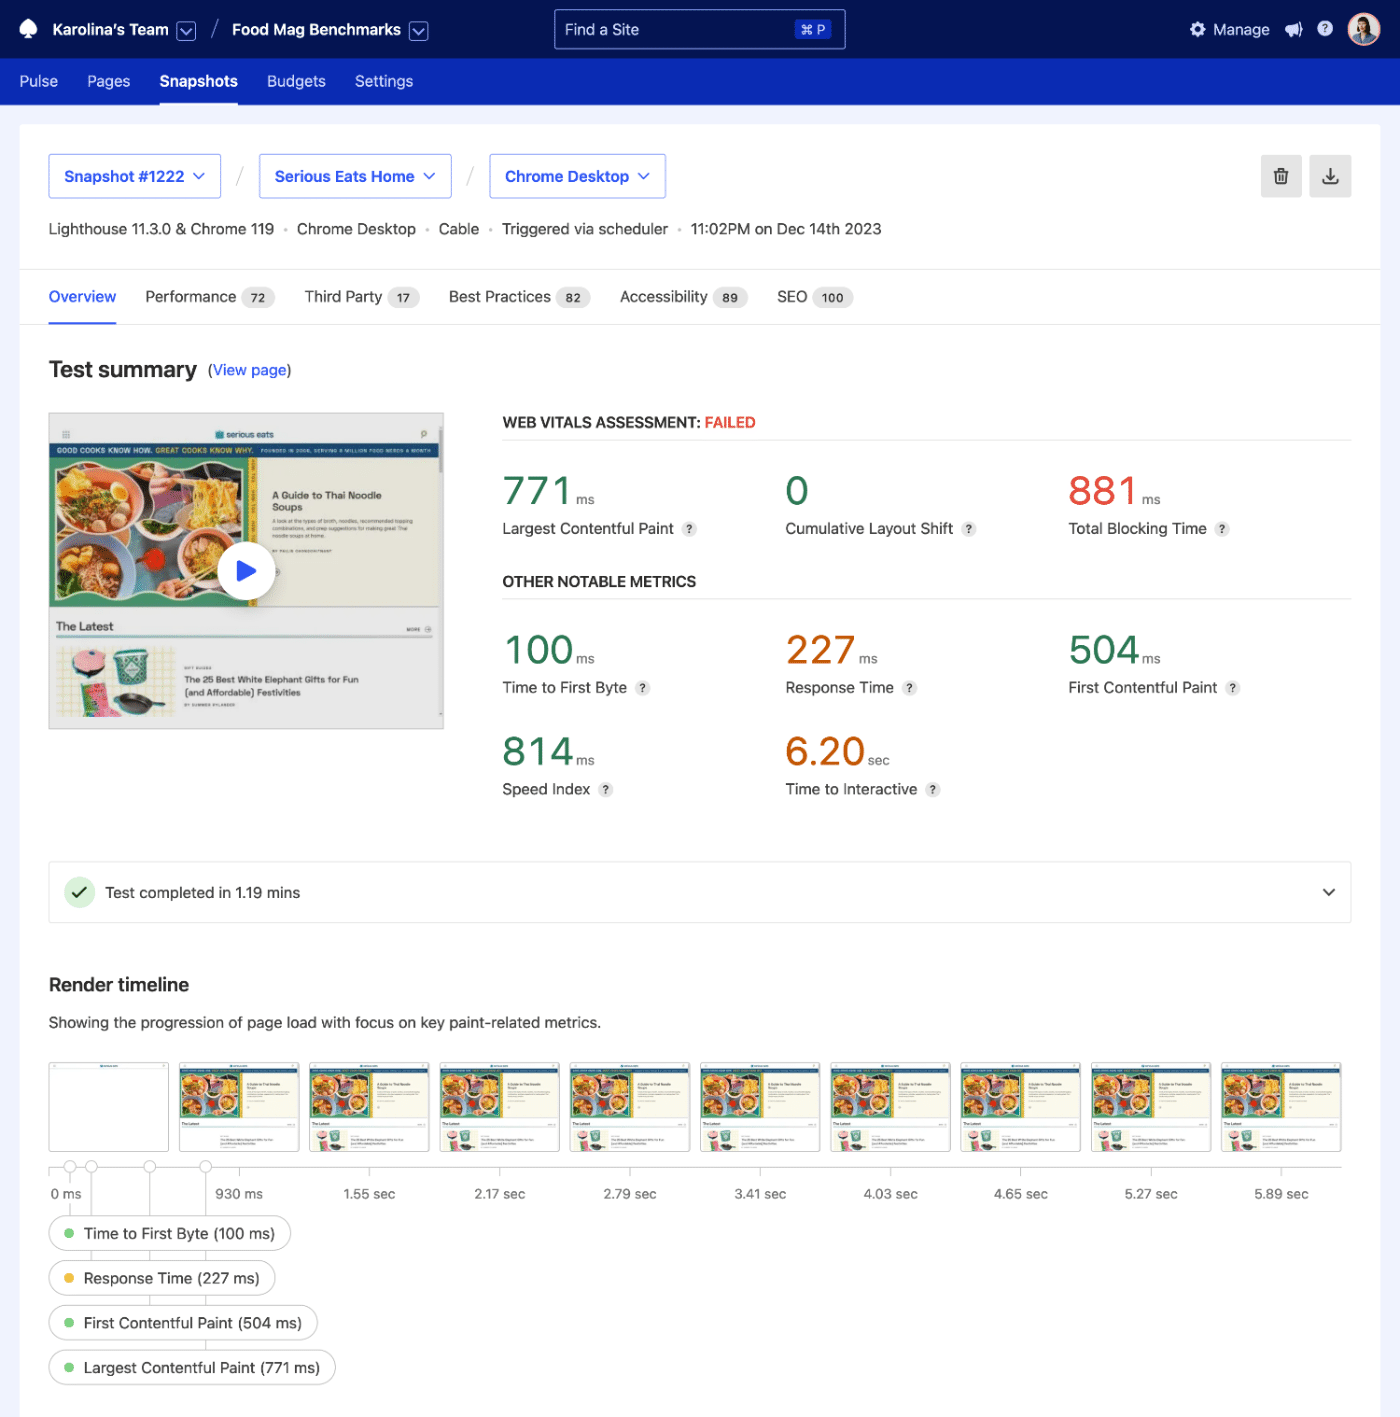
It’s now easy to check the Web Vitals assessment status, debug potential test and authentication bottlenecks, correlate key paint metrics to the rendering process, and investigate requests.
Fail Pull Request checks when performance budgets aren’t met#
It’s critical to be proactive in enforcing performance goals. If you’re using Pull Request Reviews, in September we added an option to fail Calibre’s budget checks if the pull request exceeds the budget that’s currently passing on the production site.
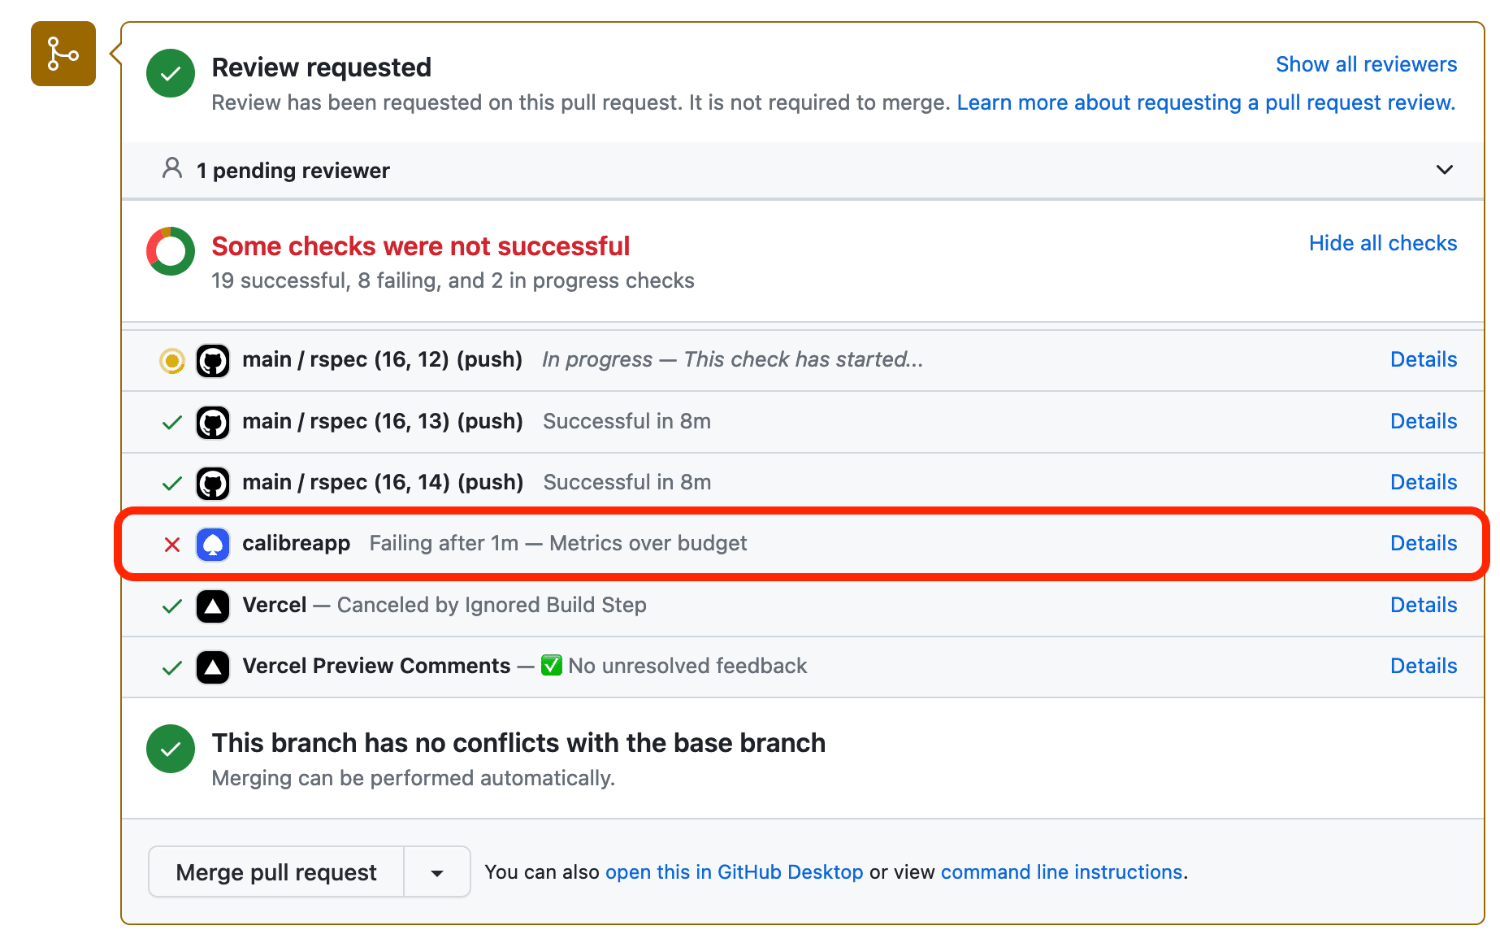
Turn pull request fail checks in GitHub integration settings. You can also use the --failOnUnmetBudget for CLI-based Pull Request Reviews!
Keep up-to-date with new releases#
We added a new release summary to the main navigation, so it’s easy to check what’s new without leaving Calibre or subscribing to product newsletters you might already read a handful of.
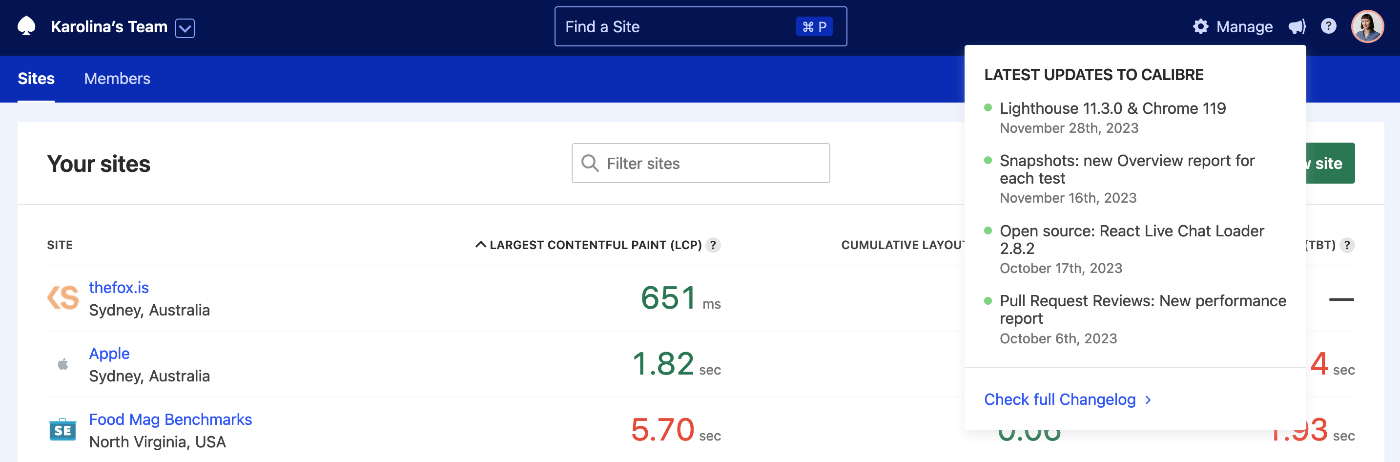
All notifications come from our Changelog, which you can access at any time.
Existing interfaces: refreshes and improvements#
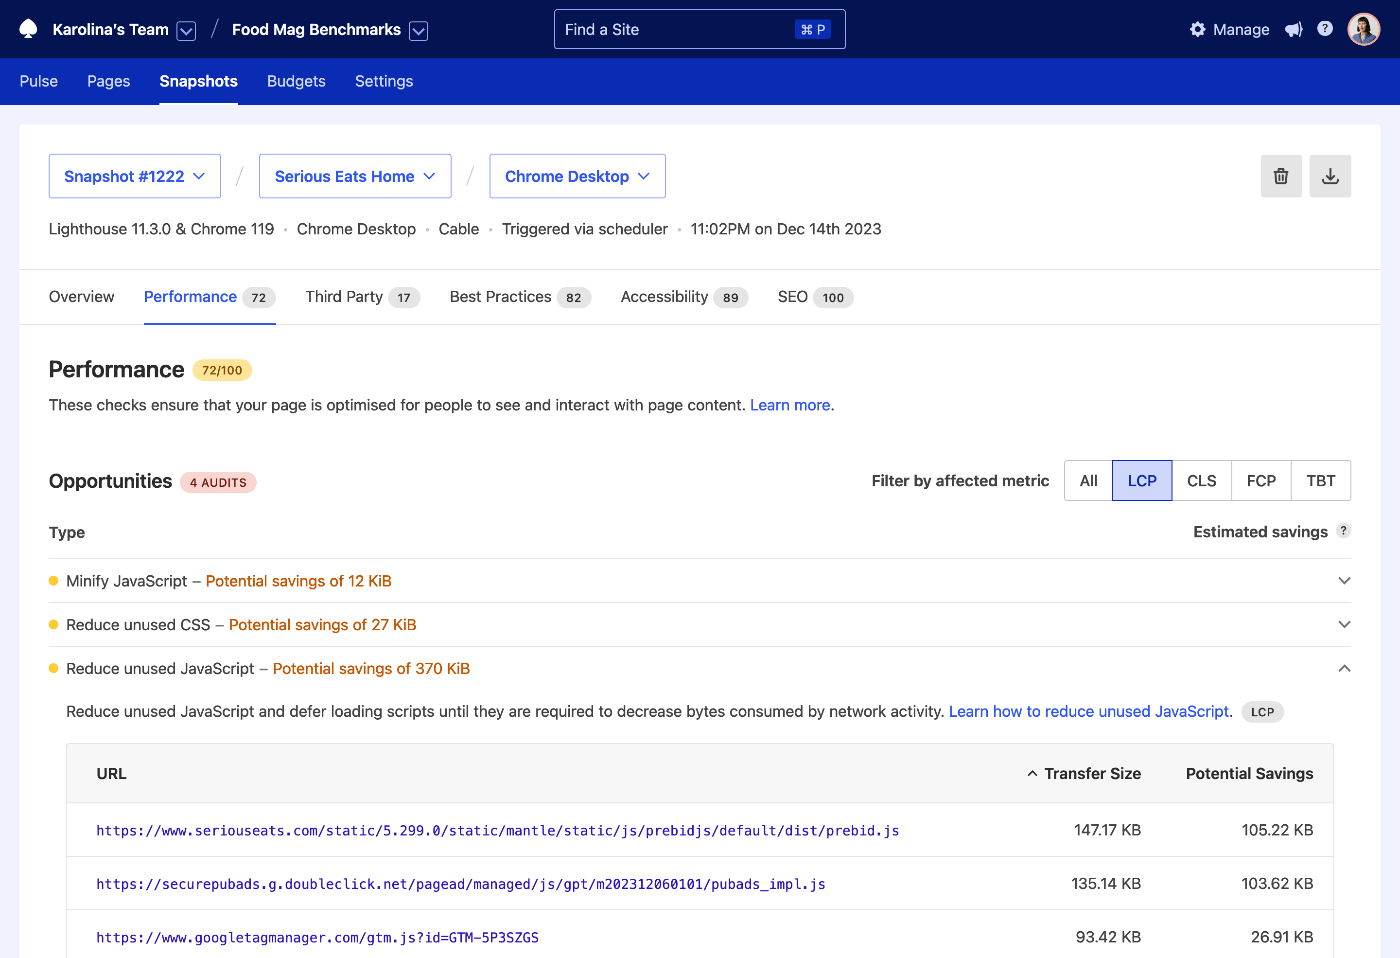
- Snapshot Audits: in January, we added the option to filter Lighthouse audits based on which Web Vital it impacts. Opportunities and Diagnostic audits are also more prominent and readable.
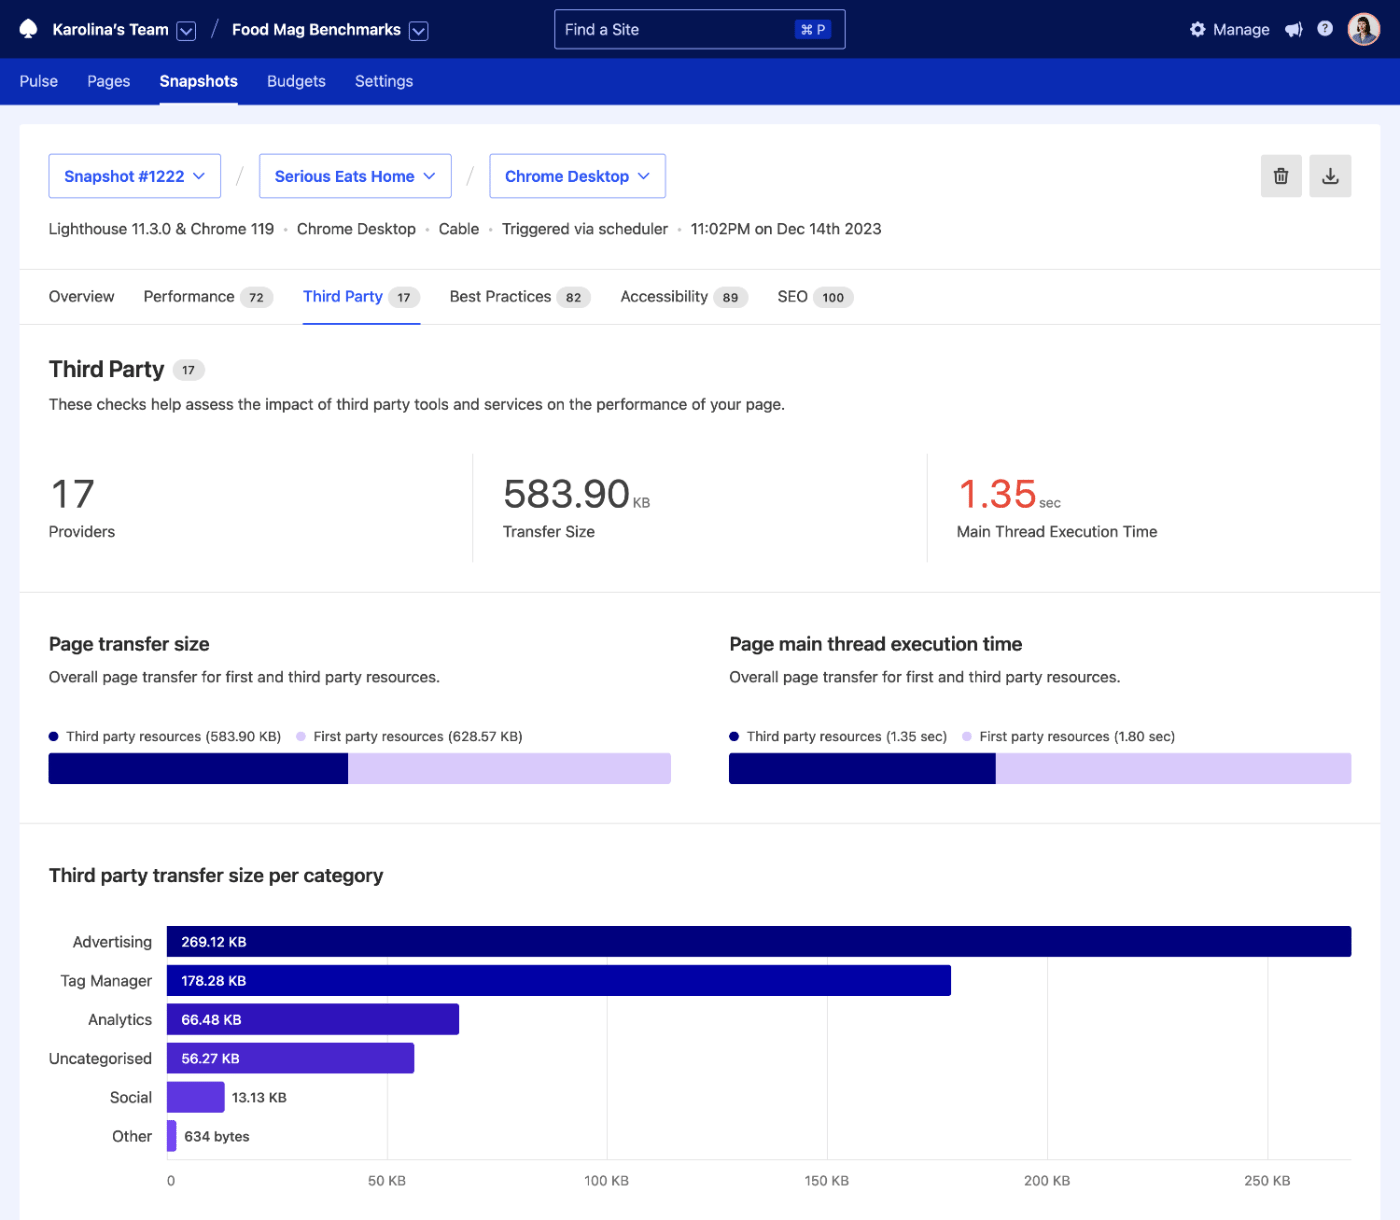
- Snapshot Third Party Report: in March, we refreshed the Third Party report for each Snapshot to better visualise the impact of external tools and services on the performance of your sites. It’s now easier to assess which third parties are the heaviest in terms of size and execution, and how they compare to your own assets.
- Performance Budgets: in September, we made it possible to create performance budgets without any alerts. You can still monitor them directly in the Budgets dashboard.
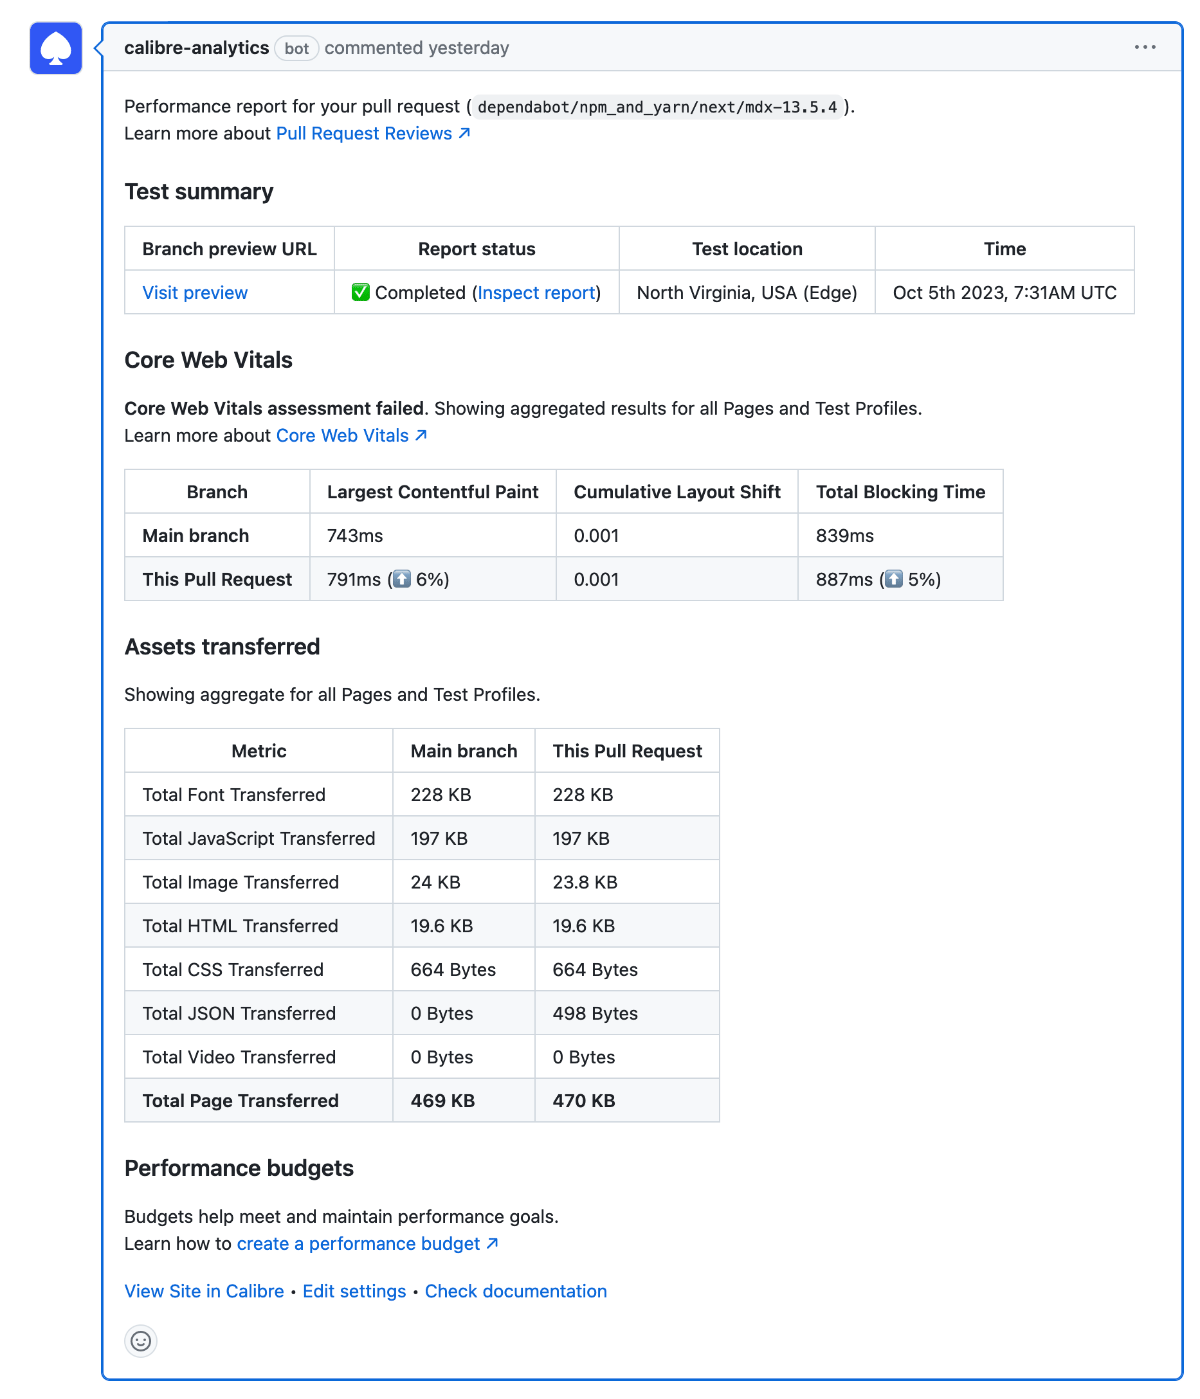
- Pull Request Reviews: in October, we overhauled the report posted on Pull Requests to focus on Web Vitals, changes to the size of assets transferred and performance budgets. It’s now even easier to assess the impact of work-in-progress and speed experiments.
- More accessible ways to select: in November, we audited and rebuilt selects and dropdowns. Those elements can be now reliably navigated with a keyboard and assistive technologies. They are also more responsive, readable and searchable.
CLI and API#
Pull Request Reviews: now available in CLI#
A few years ago, we introduced Pull Request Reviews as a way of comparing production to work-in-progress (for example, staging environment). Until now, Pull Request Reviews have only been accessible on GitHub. With the recent changes, you can run Pull Request Reviews in CI/CD systems via the CLI:
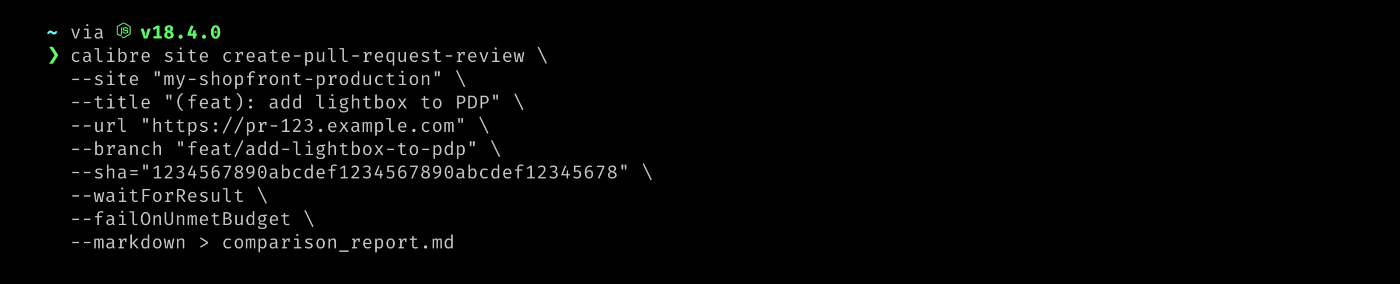
Read the Pull Request Review CLI documentation for more information.
Single Page Tests: better report, markdown and webhooks export#
We redesigned the command line output for Single Page Tests to include Core Web Vitals assessment, and key assets transferred:
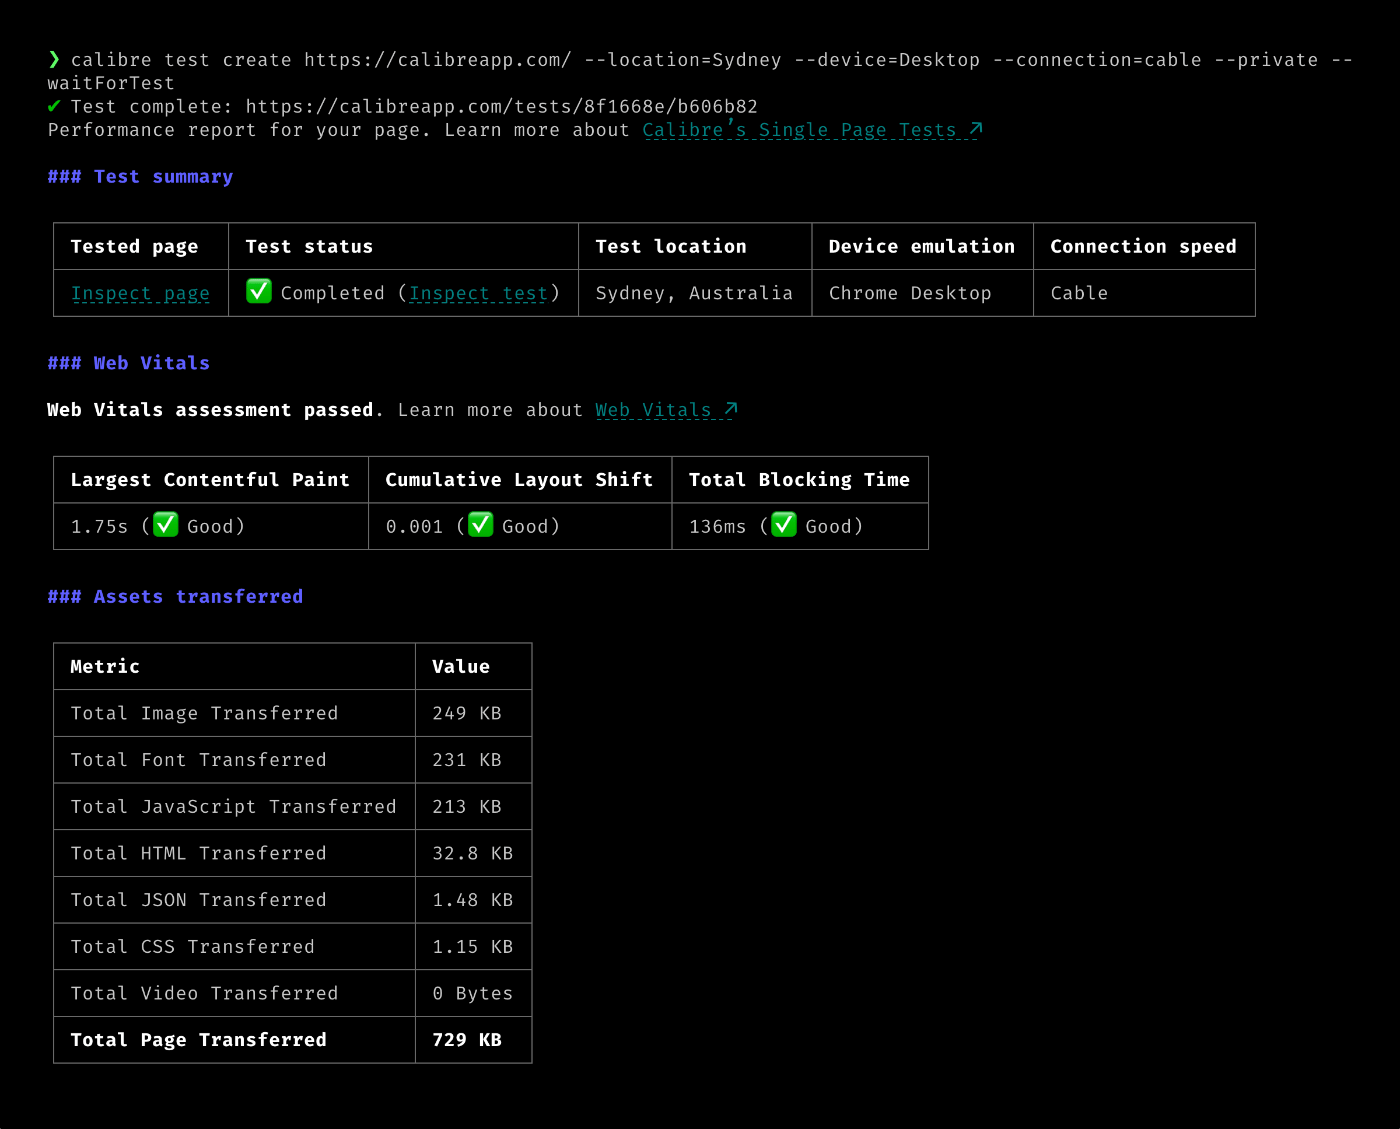
Each Single Page Test result is also available in markdown format (thanks to the --markdown flag), which can be rendered in any environment with markdown support. Another new way of sending Single Page Test results elsewhere is posting it to a Webhook URL (using --webhookUrl flag).
Find out more in Single Page Test documentation and CLI command list.
Brotli compression for test artifacts#
Since July, we’ve been compressing test artifacts (lighthouse.json, har.json and any other JSON-based reports) using Brotli instead of Gzip. This change resulted in 15-30% decrease in downloaded file size.
Check the full CLI changelog on GitHub.
Lighthouse: from 10 to 11.3.0#
We continue to offer a tight integration with Lighthouse, expanded by platform features not available when running Lighthouse in the browser or command-line interface. In 2023, we went through two major version upgrades, including the 10.0 release with changes to Time to First Byte calculation, Largest Contentful Paint phases, new audits, and updated Performance Score calculation.
We also keep advocating for changes in Lighthouse that result in better reporting—such as increasing supported domains from top 25, to a much more inclusive set.
Web performance education and resources#
This year, we sent issue 141 of Performance Newsletter, our biweekly email about all things web performance and user experience (check a preview here). It’s been great to observe the rising interest and research into speed, and amplify it.
Subscibe to Performance Newsletter to receive page speed news, case studies, tool highlights and more. In your inbox, every two weeks.
We also invested into writing about web performance metrics and up-to-date strategies. Here’s some of our research:
- Your Web Performance is Too Reactive; It’s Time to Do More Than Put Out Fires
- 5 Beginner Website Speed Optimisations and How to Do Them Right
- Interaction to Next Paint (INP): What is it and How to Improve It
- The Calm Web: A Solution to Our Scary and Divisive Online World
- Time to First Byte: What it is and How to Make Improvements
- Psychology of Speed: A Guide to Perceived Performance
If you’d like to be notified of new articles, you can subscribe to the Performance Newsletter or use our RSS feed.
What’s coming in the future#
At the beginning of 2024, we will be adding real user data to Calibre. Firstly, it will originate from the Chrome User Experience Report (CrUX). While CrUX has its limitations, teams use it as a starting point to their real user monitoring adventure or as another data source in their analysis arsenal. You will be able to benchmark Sites based on Core Web Vitals, track P75 values over time, and quickly check the percentage of good and poor experiences. The introduction of CrUX integration will also add Interaction to Next Paint as a metric.
Right after, we will update the Pulse and Metric dashboards with new charts. We have prioritised readability as well as different ways of aggregating web performance data to discover trends. We’ll introduce more filtering options (P50, P75, P90, P95) and grouping by day, month, and Snapshot.
Our next priority will be a full-fledged real user monitoring solution through an embeddable script. With synthetic, CrUX and RUM data, Calibre will offer a full picture of web performance, no matter the size of your team or site.
These are a handful of high-level projects we are already committed to. Our focus remains driven by customer and community feedback—we build directly in response to what’s missing in modern web performance tooling. We’re also actively working on making performance more accessible to a wider audience, so it’s not gate-kept by complexity.
If you haven’t tried Calibre yet, you can sign up for a free, 15-day trial with no payment details needed.