Test page speed in controlled conditions, at your command
Calibre runs scheduled and on-demand browser tests, so you always know exactly what changed and why.

Track Core Web Vitals, replay how pages render, identify blocking scripts, and catch regressions before they ship.
Dashboard
See how every page performs over time
Spot trends, catch regressions at deploy time, and find your slowest pages in seconds.

Spot regressions the moment they deploy
Every metric is charted over time with deploy markers, so you can see exactly which release changed performance.
Learn about Pulse →Test from 17 global locations
Emulate 12+ real-world devices, throttle to any network speed from 2G to Cable, and schedule regular recurring tests.
Learn about Test Profiles →Analyse
Diagnose exactly what makes pages slow
View render timelines, request waterfalls, Lighthouse audits, and Third Party impact.

Watch your page load frame by frame
Replay how your page renders with a visual timeline and video. See exactly what visitors see, and when.
Learn about Snapshots →Get targeted advice for every Web Vital
Lighthouse audits for Performance, Accessibility, SEO, and Best Practices — filterable by the metric they affect.
Learn about Audits →Find the scripts blocking your main thread
See every long-running JavaScript task, which script caused it, and how much it contributes to blocking time. Filter by first or third-party.
Learn about Long Tasks →See what Third Parties cost you
Measure the transfer size and execution time of every external service on your page. Find what to keep, optimise, or remove.
Learn about Third Parties →Budgets & Alerts
Stop regressions before they reach users
Set thresholds for any metric. Get notified the moment they’re at risk.

Budgets for any metric
Set thresholds for Core Web Vitals, JavaScript size, third-party weight, or hundreds of other metrics. Know when they creep up.
Learn about Budgets →Alerts in Slack, email, or webhook
Get notified in the tools your team already uses. Connect to thousands more services through Zapier.
Learn about Integrations →Enforce budgets in pull requests
Automatically fail PR checks when a budget is exceeded. Catch regressions before they merge.
Learn about PR Reviews →Automate
Ship fast code with confidence
Catch speed regressions in pull requests or CI/CD. Setup post-deploy checks. Run tests on-demand via API or CLI.
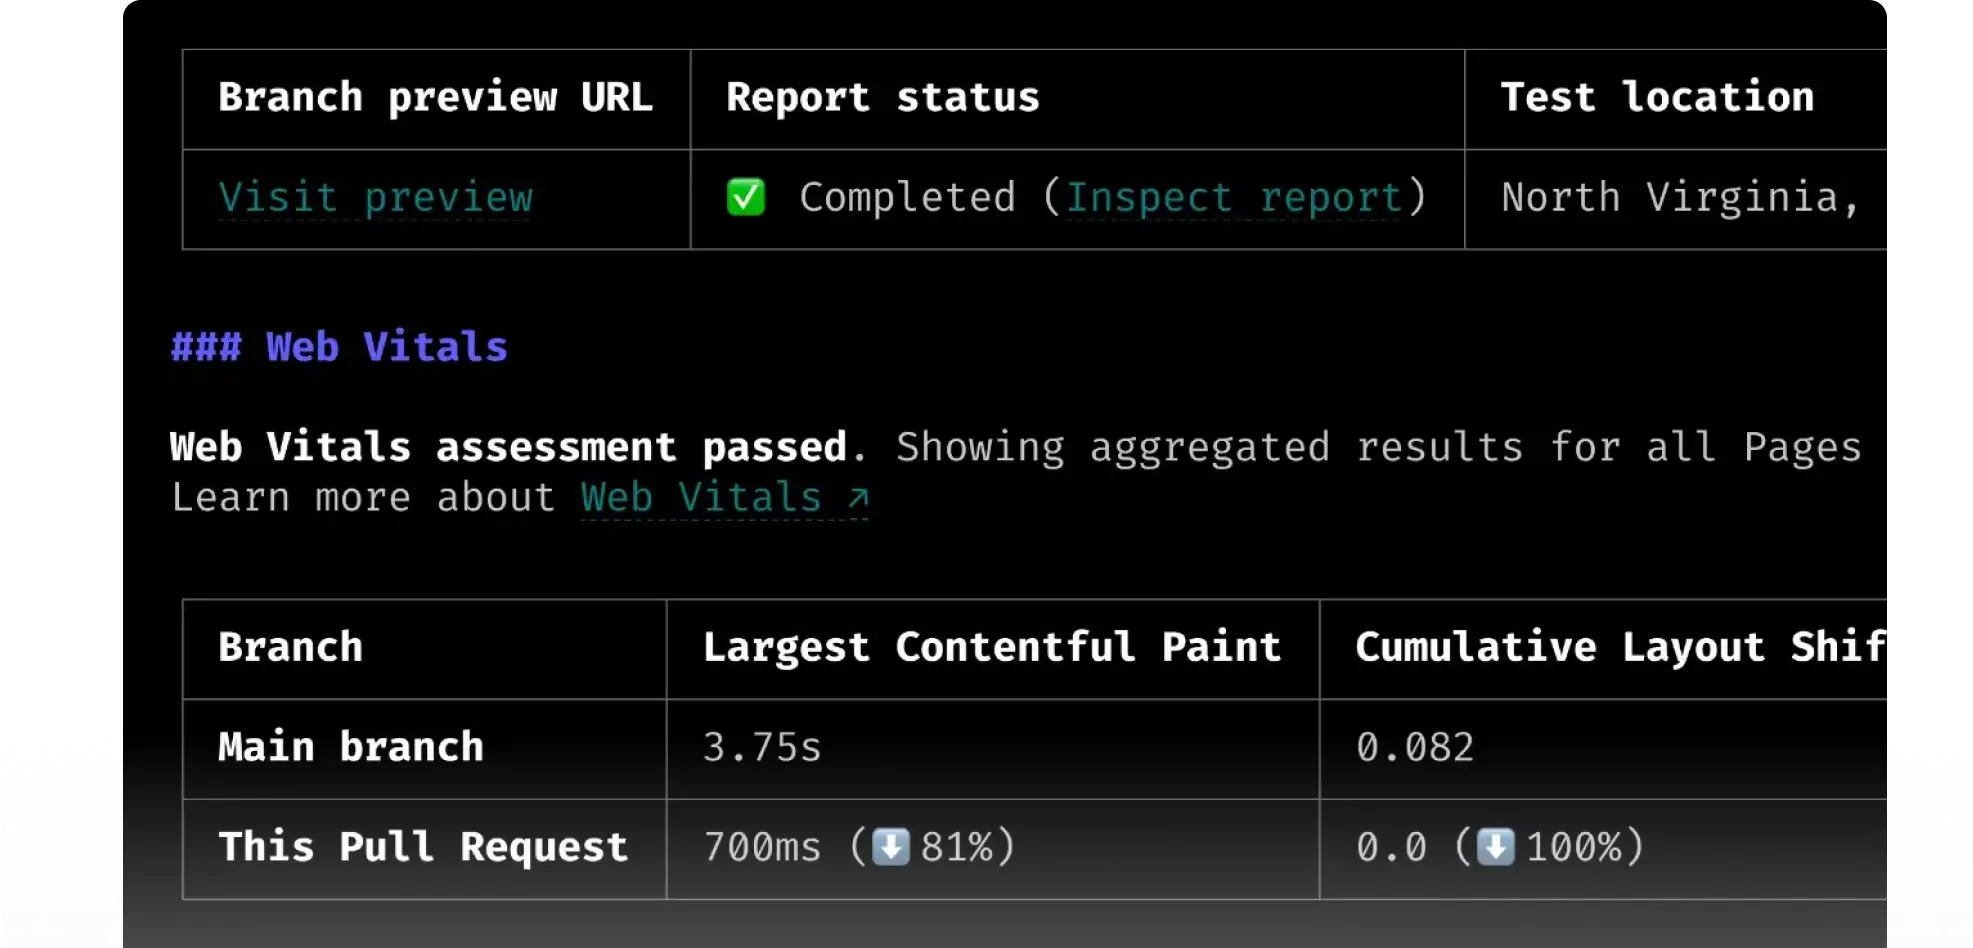
Performance reviews in every pull request
Compare work-in-progress against production. Get a formatted report with Web Vitals, asset changes, and budget status posted to your PR.
Learn about PR Reviews →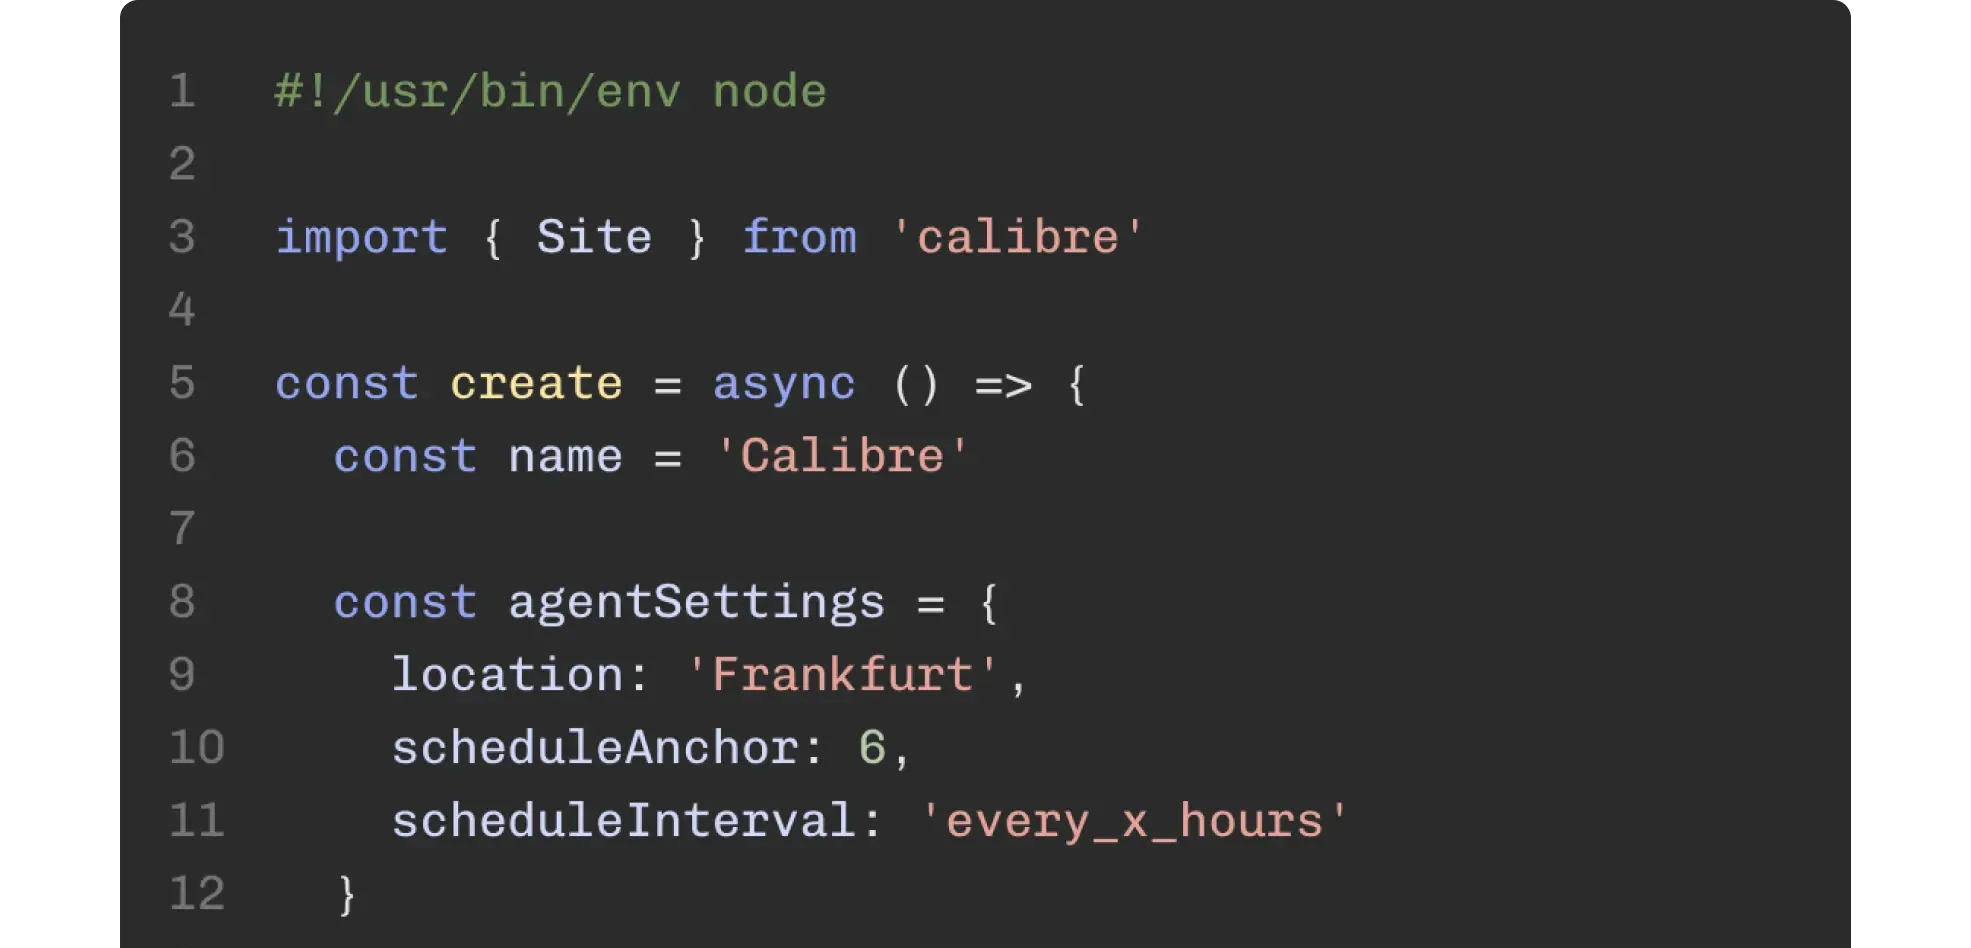
Automate with CLI, Node.js API
Create tests, export metrics, manage sites, and track deploys — all from your terminal or code.
Learn about the CLI & API →Test authenticated and private sites
Monitor logged-in pages and staging environments. Set up form authentication, cookies, or custom headers.
Learn about Authentication →Run one-off tests for any URL
Generate a full performance report for any page — shareable with stakeholders or triggered from your CI/CD pipeline.
Learn about Single Page Tests →Why choose Calibre for synthetic monitoring?
Automated, configurable testing with deep diagnostics. Performance, now part of your workflow.
Controlled, reproducible results
Same device, same network, same location — every time. When a metric changes, you know something in your code changed.
Deep diagnostics in every test
Render timelines, request waterfalls, Long Task analysis, Lighthouse audits, and third-party impact reports. One test, full picture — no extra setup.
Performance budgets that block regressions
Set thresholds for any metric. Get notified in Slack, email, or webhook — and automatically fail PR checks when budgets are exceeded.
Test behind logins, cookies, and headers
Monitor authenticated pages, staging environments, and cookie-based experiments. Your tests reflect your real application, not just the public-facing shell.
Built into your dev workflow
PR reviews, deploy markers, CI/CD pipelines, CLI and Node.js API. Performance testing lives where your code already does.
Works alongside RUM and CrUX
Synthetic tells you why pages are slow. Pair it with RUM for real user impact and CrUX for Google's perspective on your site.
“Calibre delivers the substance behind the statistics. They know the actionability of performance measurement is paramount.”

Calibre Synthetic is built for you
Included on all plans. Test from 17 locations, on any schedule, with full diagnostics on every run.
One platform for all web performance needs
Check first results in just a couple minutes. Start improving performance the same day.
