

Users want snappy and delightful experiences, which means running at 60 frames per second. To achieve this, you’ll have to know how browsers transform code to pixels on the screen and how styles can affect that process.
In this post you’ll learn how browser rendering works and how to navigate DevTools to diagnose animation performance issues. We’ll use Chrome DevTools, but other browsers have very similar features and the high-level concepts are the same everywhere.
Demystifying rendering#
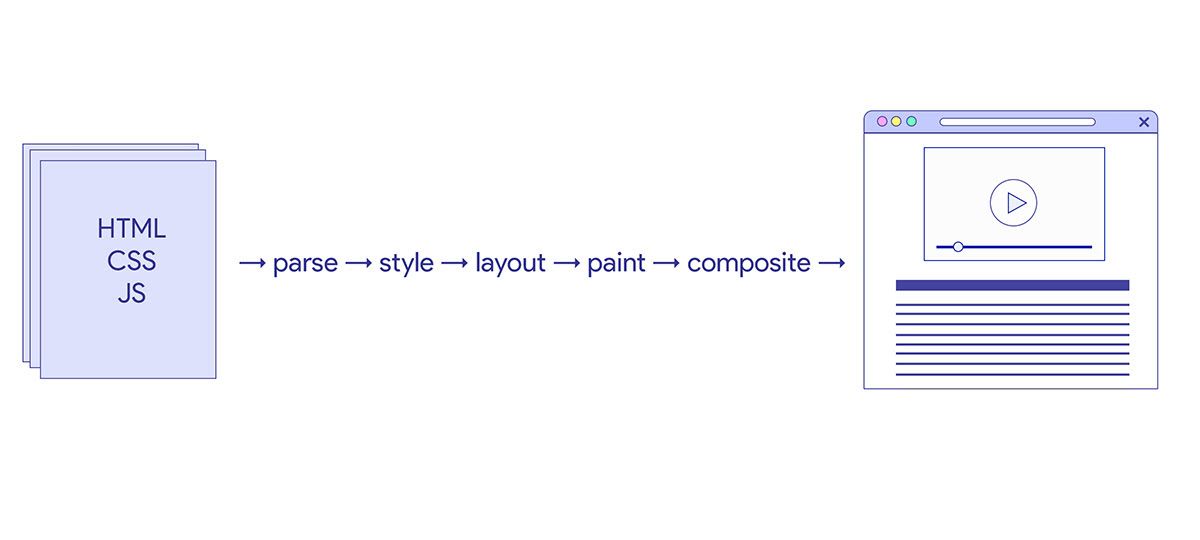
To construct a web page, the browser has to go through a number of steps:
- Parsing
- Style calculations
- Layout
- Paint
- Compositing
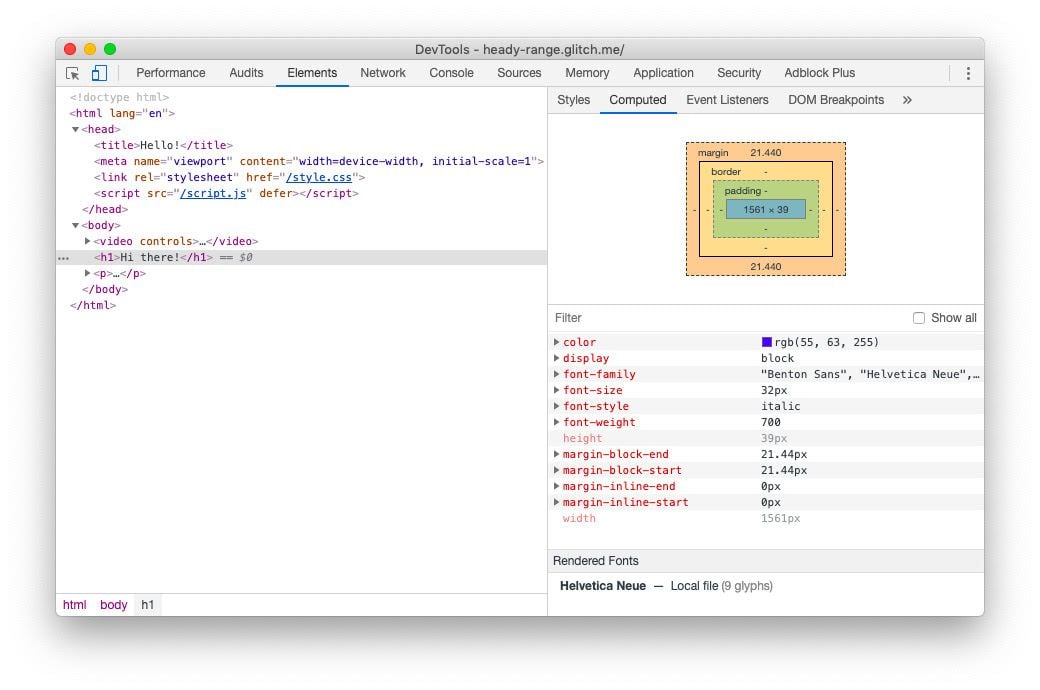
When the browser downloads and parses HTML and CSS, it creates the DOM (Document Object Model). To calculate the styles, the browser goes over all of the elements in the DOM and looks at the rules defined in stylesheets to figure out which CSS properties should be applied to each element.
To inspect the DOM and the calculated styles, open DevTools Elements panel, select an element, and navigate to the Computed section which shows the styles applied to it.
Once the browser knows which styles apply to each element, comes the layout phase where the browser figures out the dimensions and positions of all the elements it needs to display on the page. In order to that, it makes another tree — the layout tree. Elements in the layout tree are represented as vector boxes.
The layout tree is based on the DOM, but it’s usually shaped a bit different. The DOM contains all of the HTML nodes, but only the visible elements become part of the layout tree. Examples of things that the layout tree doesn’t include are:
<head><script><style><div style="display: none">
Layout tree elements don’t map directly to the visible DOM elements. Large paragraphs of text—a single DOM element—are represented as multiple boxes in the layout tree. The layout tree also includes pseudo elements that are added to CSS (these are not present in the DOM).
In the layout phase, the browser calculates how much space each box is going to take and where to place it. It does that by looking at the viewport size and the computed styles. Some of the CSS properties that affect the layout are:
heightwidthpaddingmargin- coordinates (
top,right,bottom,left)
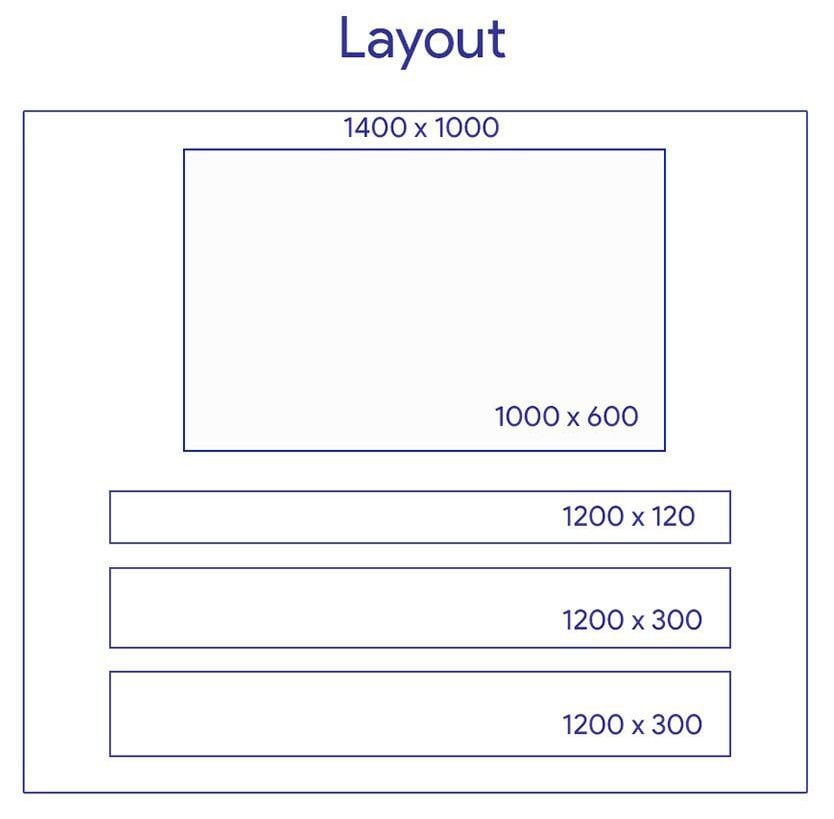
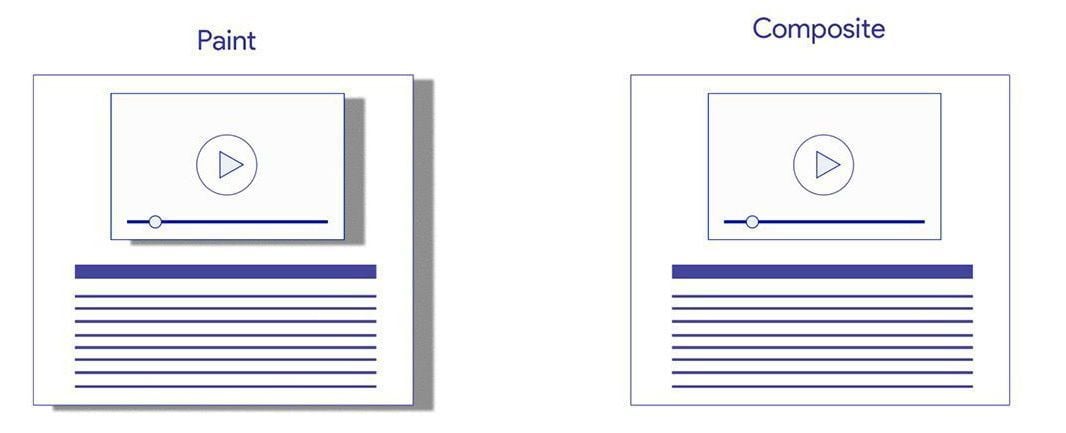
Once the layout has been established, the browser moves on to painting. It takes those vector boxes and turns them into pixels (also known as rasterizing). Paints are separated into individual layers, which can be re-painted without having to re-paint the entire page. This is especially useful to know in the context of animations.
Finally, the compositing step combines all layers into a single image that gets displayed on the screen.
Animation performance#
Animations bring otherwise static content to life and help express brand personality. They make interactions feel more natural because we’re hardwired to respond to moving objects. These animations need to be smooth and your page needs to be jank free. This is where your new knowledge about the rendering process can help you choose the best approach in coding.
Layout and repaints#
When you add or remove elements from the DOM, animate their size or position the browser has to re-calculate the positions and sizes of elements in the document. This triggers layout.
For example, if you change the width of an element, any of its children may be affected and a big part of the page layout might change. Layout is almost always scoped to the entire document, so the larger the layout tree, the longer it takes to perform layout calculations.
And it is always followed by a paint.
When elements on the screen change, certain areas need repainting. But repaints are not always triggered by layout changes. The appearance of an element can be changed in a way that does not affect the layout. For example if you change the background color or outline, the size and position of the element aren’t changing, so there’s no need for the browser to do the layout—only repaint. And because the page is painted in layers, only parts of the screen need repainting.
To see how changing different CSS properties affects paint, layout and compositing, check out CSS Triggers.
Layers and compositing#
When animating elements, it’s important to minimize layout and repaints. By taking advantage of the compositing process, you can create performant animations.
Modern browsers can animate four things really cheaply: position, scale, rotation and opacity.
| Property | Value |
|---|---|
| Position | transform: translate(x, y) |
| Scale | transform: scale(n) |
| Rotation | transform: rotate() |
| Opacity | opacity: 0..1 |
Browsers make optimizations by creating separate layers for elements with CSS transitions or animations on those four properties. When you have an animated element on its own layer, moving it around doesn’t affect the positions of surrounding elements, the only thing that moves is that layer. This way the browser avoids repaints and does only compositing.
The reason why compositing is a fast operation is that it happens on the GPU. GPU is a like a separate computer inside your device. It is a standalone unit with its own processors and its own memory. It’s designed for performing the complex mathematical calculations that are necessary for graphics rendering so it’s able to compose images very quickly, which takes the load off the CPU.
To animate an element in a separate layer with compositing, the browser has to be sure that the animated CSS property:
- does not affect the document’s flow
- does not depend on the document’s flow
- does not cause a repaint
Otherwise, for every animation frame, the browser would have to recalculate the element’s geometry (do layout), render the image of the page’s new state (do repaint) and then send it again to the GPU to display on screen. With animated elements on separate layers, it’s just moving layers around or changing their opacity and that is exactly where the GPU shines.
With that in mind, here are some tips:
- Instead of changing
heightandwidthproperties, usetransform: scale(). - To move elements around, avoid changing
top,right,bottom, orleftproperties and usetransform: translate()instead. - If you want to blur the background, consider using a blurred image and changing its
opacity.
Animating elements with transform and opacity aren’t the only reasons for a browser to create separate layers. The way browsers split pages into layers is not standardized, so they can take slightly different approaches based on different heuristics.
Things that are likely to change, like elements with animated properties, usually get a separate layer. Different text boxes are usually painted on a single layer because they are likely to stay in place relative to each other.
Why isn’t everything in a separate layer? Well, apps (such as browsers or video games) have to communicate with the GPU as if it’s an external device. Transferring objects to the GPU takes time and each layer incurs a memory cost. This can be especially problematic on lower-end devices, so browsers have to balance between the GPU speed and the cost of processing layers.
Tools for identifying animation performance issues#
Chrome DevTools FPS meter#
To setup a successful animation performance analysis session, first enable the FPS meter.
- Go to the example repository.
- Press
Command+Option+I(Mac) orControl+Shift+I(Windows, Linux) to open DevTools. - Press Command+Shift+P (Mac) or Control+Shift+P (Windows, Linux) to open the Command Menu.
- Start typing
Renderingin the Command Menu and select Show Rendering. - Select the FPS meter checkbox.
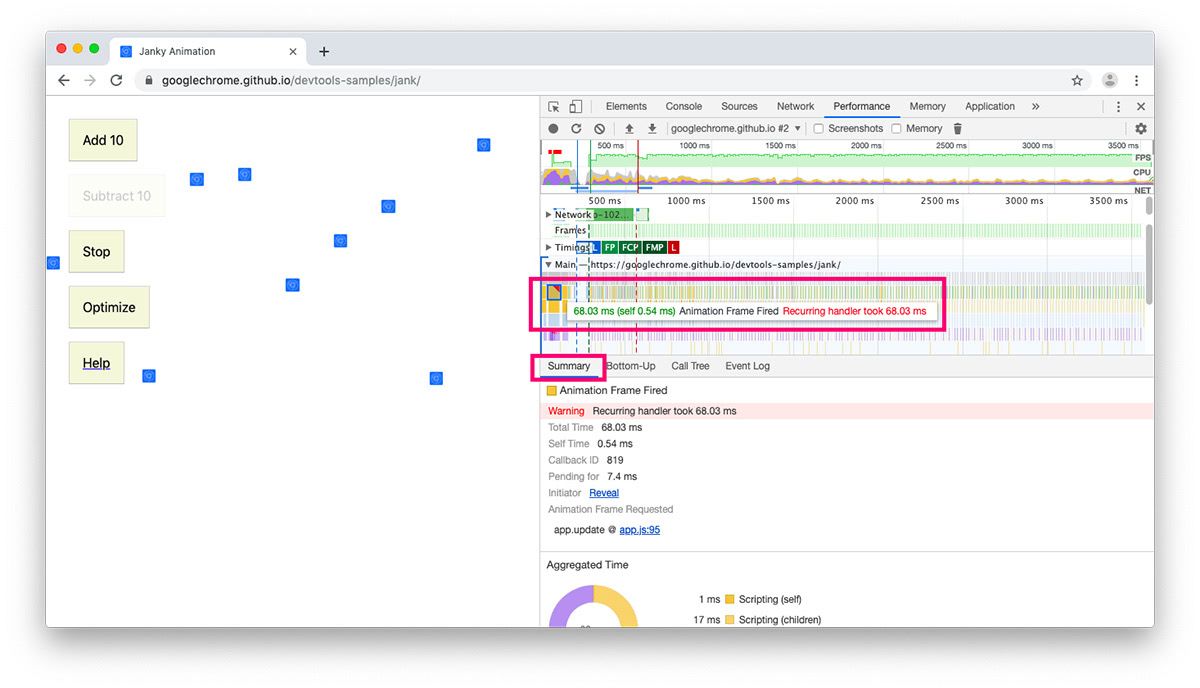
Note: Animation performance can be affected by JavaScript, because style, layout and paint all happen on the browser’s main thread, alongside JavaScript execution. If the main thread is too busy running JavaScript, your animations can get slow and choppy.
Remember the rendering pipeline? Here’s a reminder:
parse → style → layout → paint → composite
Tasks related to animation performance are purple (style and layout) and green (painting and compositing). Try tracing a simple page so you can identify each of the steps from above in DevTools:
- Open this.
- Press
Command+Option+I(Mac) orControl+Shift+I(Windows, Linux) to open DevTools. - In DevTools, click the Performance tab.
- Press
Command+Shift+Eto start profiling and reload the page.
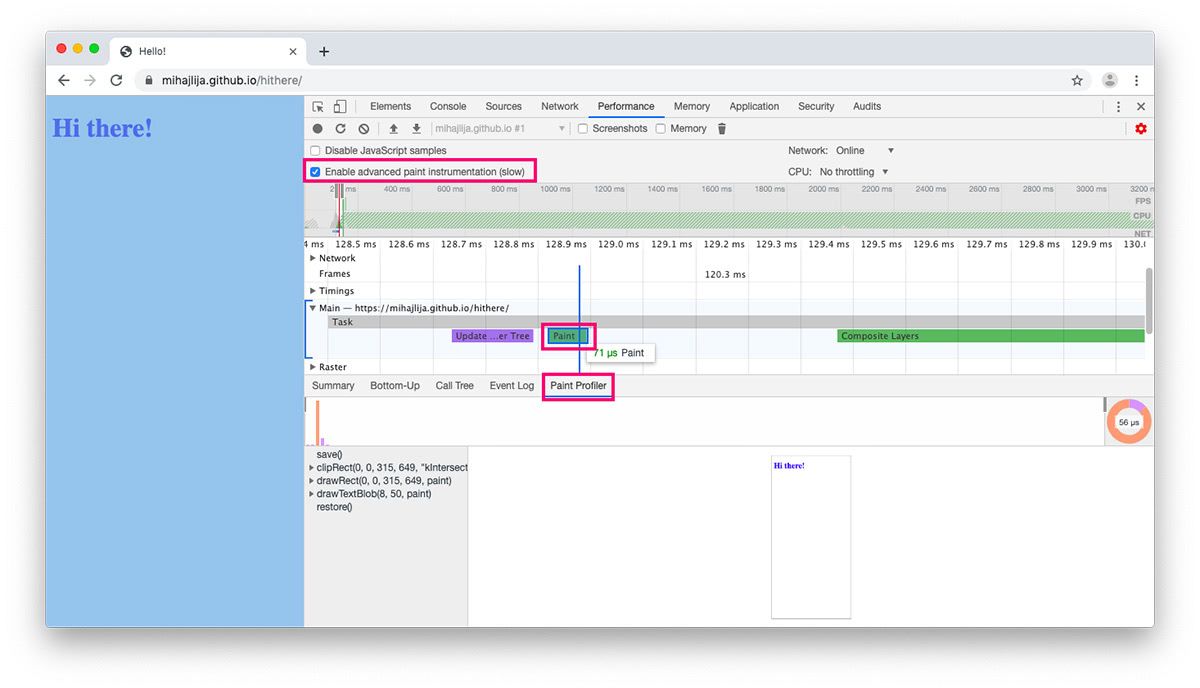
For this simple page, the browser drew one rectangle for the body with drawRect() and “Hi there!” with drawTextBlob().
Chrome DevTools Layers panel#
You can see what your page’s layers look like in 3D in the Layers panel. To enable it, while in DevTools:
- Press Command+Shift+P (Mac) or Control+Shift+P (Windows, Linux) to open the Command Menu.
- Start typing
Layersin the Command Menu and select Show Layers.
You can zoom, rotate, and drag the layers model to explore its contents. Hovering over a layer reveals its current position on the page. When you select a layer, the Details panel displays its memory consumption and the reason for the compositing. Keep the number of layers relatively low and watch out for memory hungry layers.
Recap#
Now that you know about all the different tools for investigating rendering performance, go ahead and optimize your pages. To make sure your animations don’t cause performance issues, consider the impact of animating a given CSS property. Avoid layout recalculations and minimize repaints. Where you can, stick to changing transforms and opacity.
Happy coding!