
We’ve always been strong advocates of proactive web performance approach. As a small team, we even more so understand how hard it is to undo already shipped changes or prioritise work that’s often considered non-business critical. For that reason, over three years ago, we released Pull Request Reviews to help teams monitor performance before releasing to production, directly in their pull requests. Since then, we’ve learned a lot about complexities of comparisons and what we could do to offer the most clear and actionable web performance report at the point when it matters most.
From those trials, errors and challenges faced by our customers and the wider community, we defined key points to solve with the next iteration of Pull Request Reviews:
- It’s too easy to release a performance degradation to production. With the majority of speed tooling relying on production, post-release monitoring, we find about performance issues far too late, when they’ve already negatively impacted our audience.
- It’s too difficult to create a system for monitoring work in progress. While it’s possible to create a custom solution to track web performance of Pull Requests, it requires a significant amount of work and maintenance to make it reliable.
- It’s too difficult to conduct performance experiments. We need confidence that performance experiments are going to have a positive result. We also need to rely on more than just browser traces.
- It’s too difficult to collaborate on web performance. It should be considered at all steps of a project, instead of gate-kept to certain roles, stages, and services, which don’t share data between each other.
- It’s too difficult to enforce standards. If performance budgets are disconnected from the resources they consider, we cannot effectively maintain them.
- It’s too difficult to find out which areas should be worked on first. Performance data is overwhelming to analyse, so we need a report that highlights the most critical changes.
Pull Request Reviews 2.0: your go-to for pre-release monitoring in CI/CD and GitHub#
With the new iteration of Pull Request Reviews, we addressed most of the common pain points described above. Now, with Pull Request Reviews, your team can:
- Collaborate on web performance directly in GitHub and CI/CD tools
- Check performance before releasing code to production
- Easily run experiments to improve performance
- Prevent code releases if performance budgets are exceeded
Get a speed report that focuses on what’s most important#
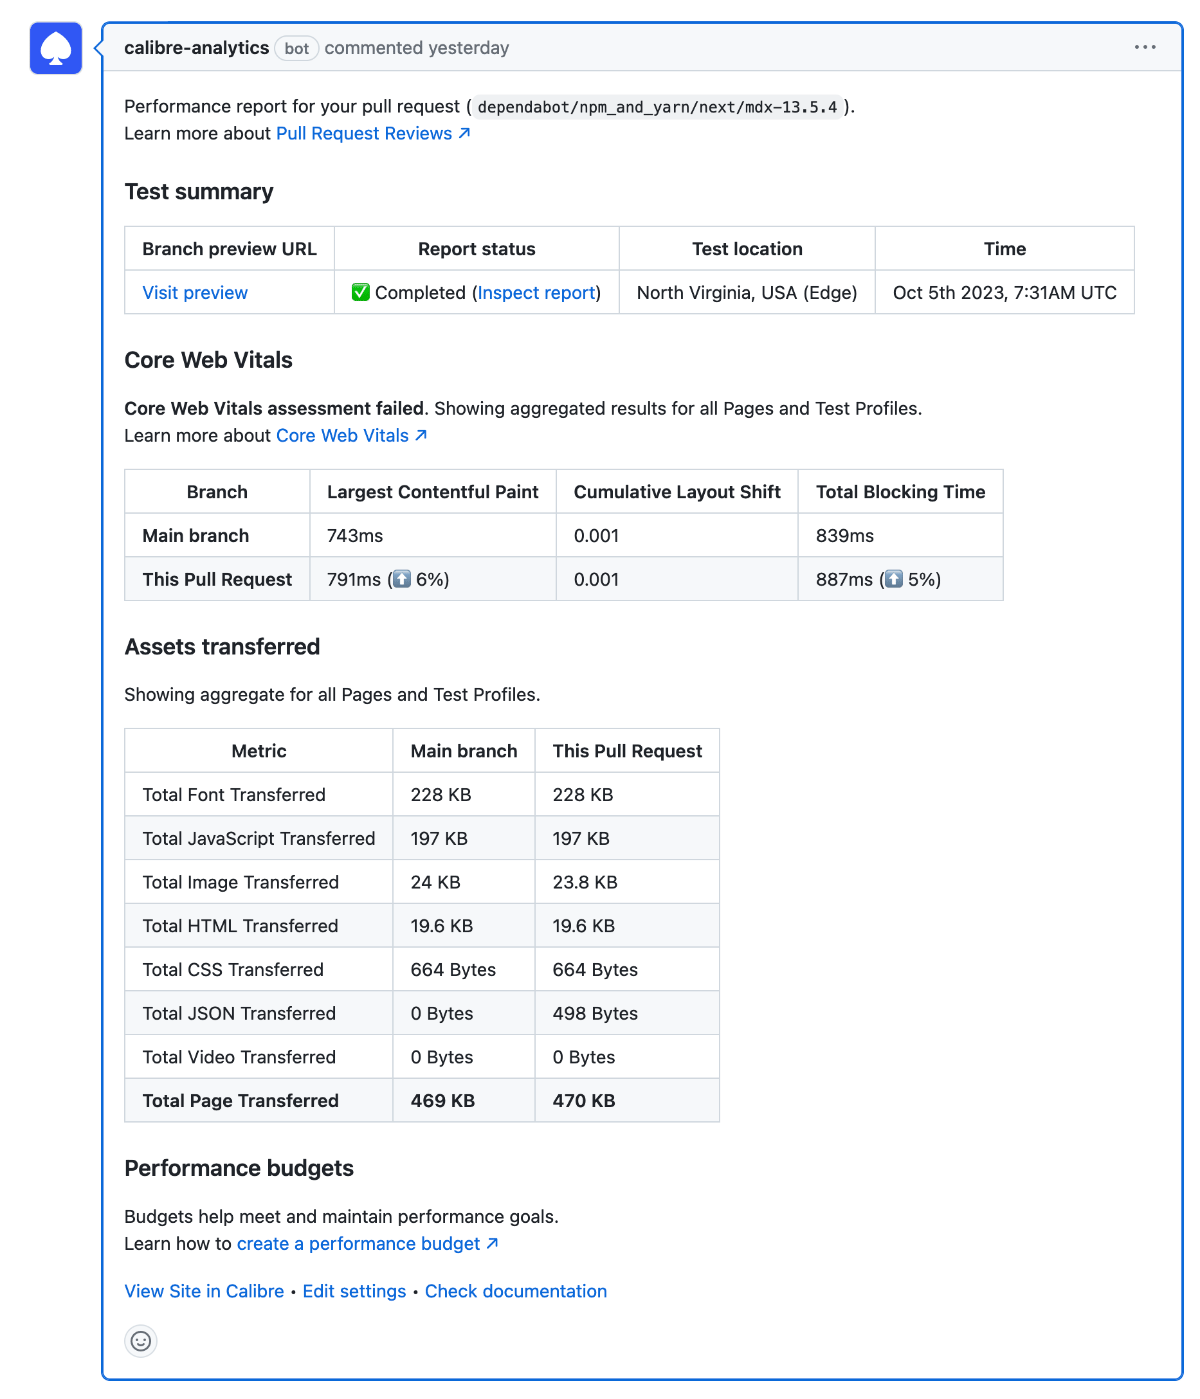
We reimagined the report posted when a Pull Request Review is completed to highlight the most important information to take action:
- Web Vitals assessment status and metric changes
- Assets transferred and how they changed
- Status of performance budgets
If your team isn’t using GitHub, you can get the same markdown report through the Pull Request Reviews CLI command (with the --markdown > your-file.md flag) described below.
Add speed monitoring to your CI/CD#
Not every team uses GitHub to collaborate on code. If that’s you, or your team would like to perform tests in continuous integration and delivery tools, you can use the same Pull Request Review functionality thanks to the new calibre site create-pull-request-review command:
calibre site create-pull-request-review \
  --site "my-shopfront-production" \
  --title "(feat): add lightbox to PDP" \
  --url "https://pr-123.example.com" \
  --branch "feat/add-lightbox-to-pdp" \
  --sha="1234567890abcdef1234567890abcdef12345678" \
  --waitForResult \
  --failOnUnmetBudget \
  --markdown > comparison_report.md
The command line interface makes it trivial to perform comparisons between two environments, such as staging and production, work in progress branch and production, and so on. You can use Bitbucket, GitLab, CircleCI, Jenkins or any other CI/CD tool of your choice.
Fail checks when performance budgets are exceeded#
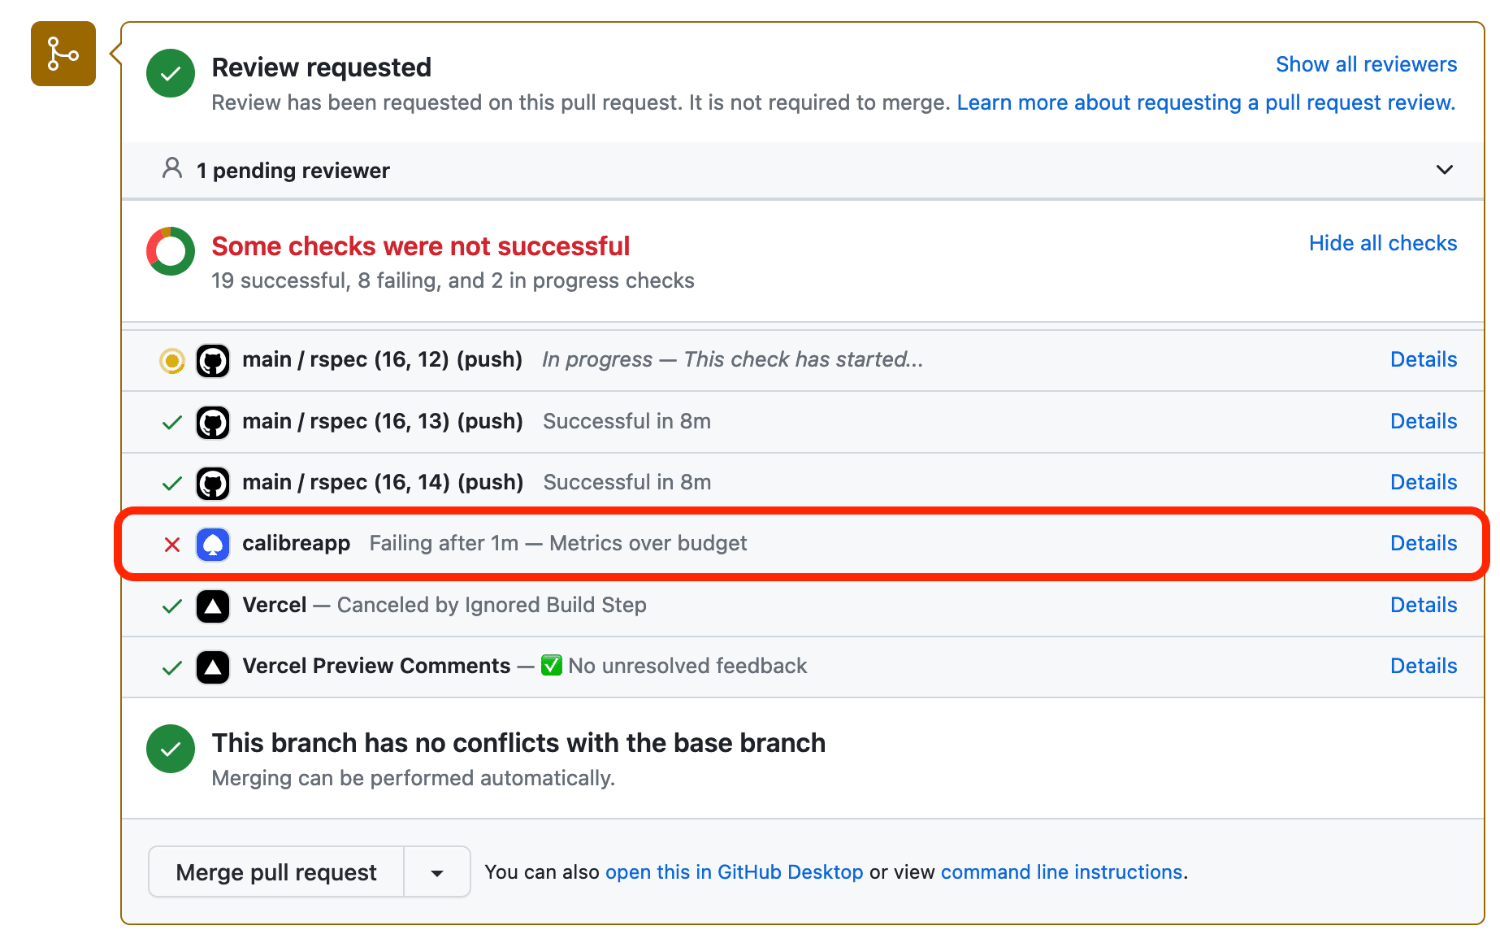
If you’d like to be more proactive than relying entirely on performance budget alerts (happening post release), you can fail checks when budgets are exceeded. With the check in place, negative changes to performance are much less likely to reach your audience.
Start testing performance proactively#
If you’d like to find out more about Pull Request Reviews, here are a few helpful resources:
- How to set up Pull Request Reviews in GitHub
- CI/CD Performance tests
- Pull Request Reviews command line interface commands
If you’re new to Calibre, you can sign up for a free 15-day trial. Need more time? We’ll happily extend the trial period, too.