
For years, our customers have told us the same thing: “We love Calibre for synthetic & CrUX monitoring. When are you adding RUM?”
Today, Real User Monitoring is available on all Calibre plans.
Why RUM? Why now?#
I fully acknowledge that we exist during a strange moment in software, and the greater web ecosystem itself. AI, agents and LLMs dominate social media, tech press and some form of global consciousness too.
And yet, with all these “amazing” and “revolutionary” technologies, the web is still slow, and user experience on a whole, is poor for millions of people. The web is a mess, and it requires supreme focus and dedication by time-poor people to make any tangible impact.
On our side, Calibre’s competitors are predominantly well-funded companies with shareholders and quarterly earnings reports. Their RUM products, (or full-blown APM products) are huge, sprawling, complex and often have very unpredictable pricing.
When I started looking seriously at embarking on the RUM project at Calibre, I quickly realised that I didn’t want to use competing products as a reference point. Quite the opposite.
Calibre RUM had to be a natural extension of our existing long held philosophy of what tools should do — avoid busywork, do more with less, be focused, privacy-first, lightweight, and get out of your way. Simple, beautiful, powerful.
Fast websites don’t just happen by themselves#
Actually ensuring a quality web experience isn’t the job of just one person, tool, skill or idea. To make headway, you need a group of people, set of tools, multidisciplinary skills, and a dedication to continuous improvement.
In Calibre, we now have three data sources to help support that:
Synthetic monitoring is your controlled environment. Use it to test work-in-progress pull requests, run checks in CI/CD, and maintain a stable baseline of test profiles. When something changes, Calibre's reports show you exactly what shifted and where. Synthetic testing is proactive — you catch problems before they reach anyone.
CrUX monitoring gives you Google’s field data. Track your own marketing site, benchmark against industry leaders, or rank your competitors — all from the Chrome User Experience Report. Calibre's web spider automatically discovers pages that appear in the CrUX dataset, so you get coverage without manual setup.
Real User Monitoring gives you depth. It captures Core Web Vitals and UX signals from live browser sessions on your site. You see the full story: overall status, problem metrics, slow pages, the specific elements leading to poor experiences. RUM shows you what’s actually happening for real people, right now.
Most web performance tools measure pageviews. Calibre RUM samples fully anonymised user sessions. Each session encompasses UX for a given visitor. Calibre tracks URLs and Core Web Vitals alongside other UX signals.
This is a better model for understanding real user experience, and paints a detailed picture of problem areas on your sites.
How we use Calibre#
We run Synthetic monitoring for internal projects like this website, and the dashboards that power the product. We see when changes happen and respond to them.
CrUX gives us an understanding of the world around us, and is an incredible research tool (see our Global leaderboard for e-commerce for an example).
RUM shows us clearly where improvement can be made. Everything is ranked by impact, problems and hotspots are easy to identify & fix.
What you get with Calibre RUM#
The dashboard#
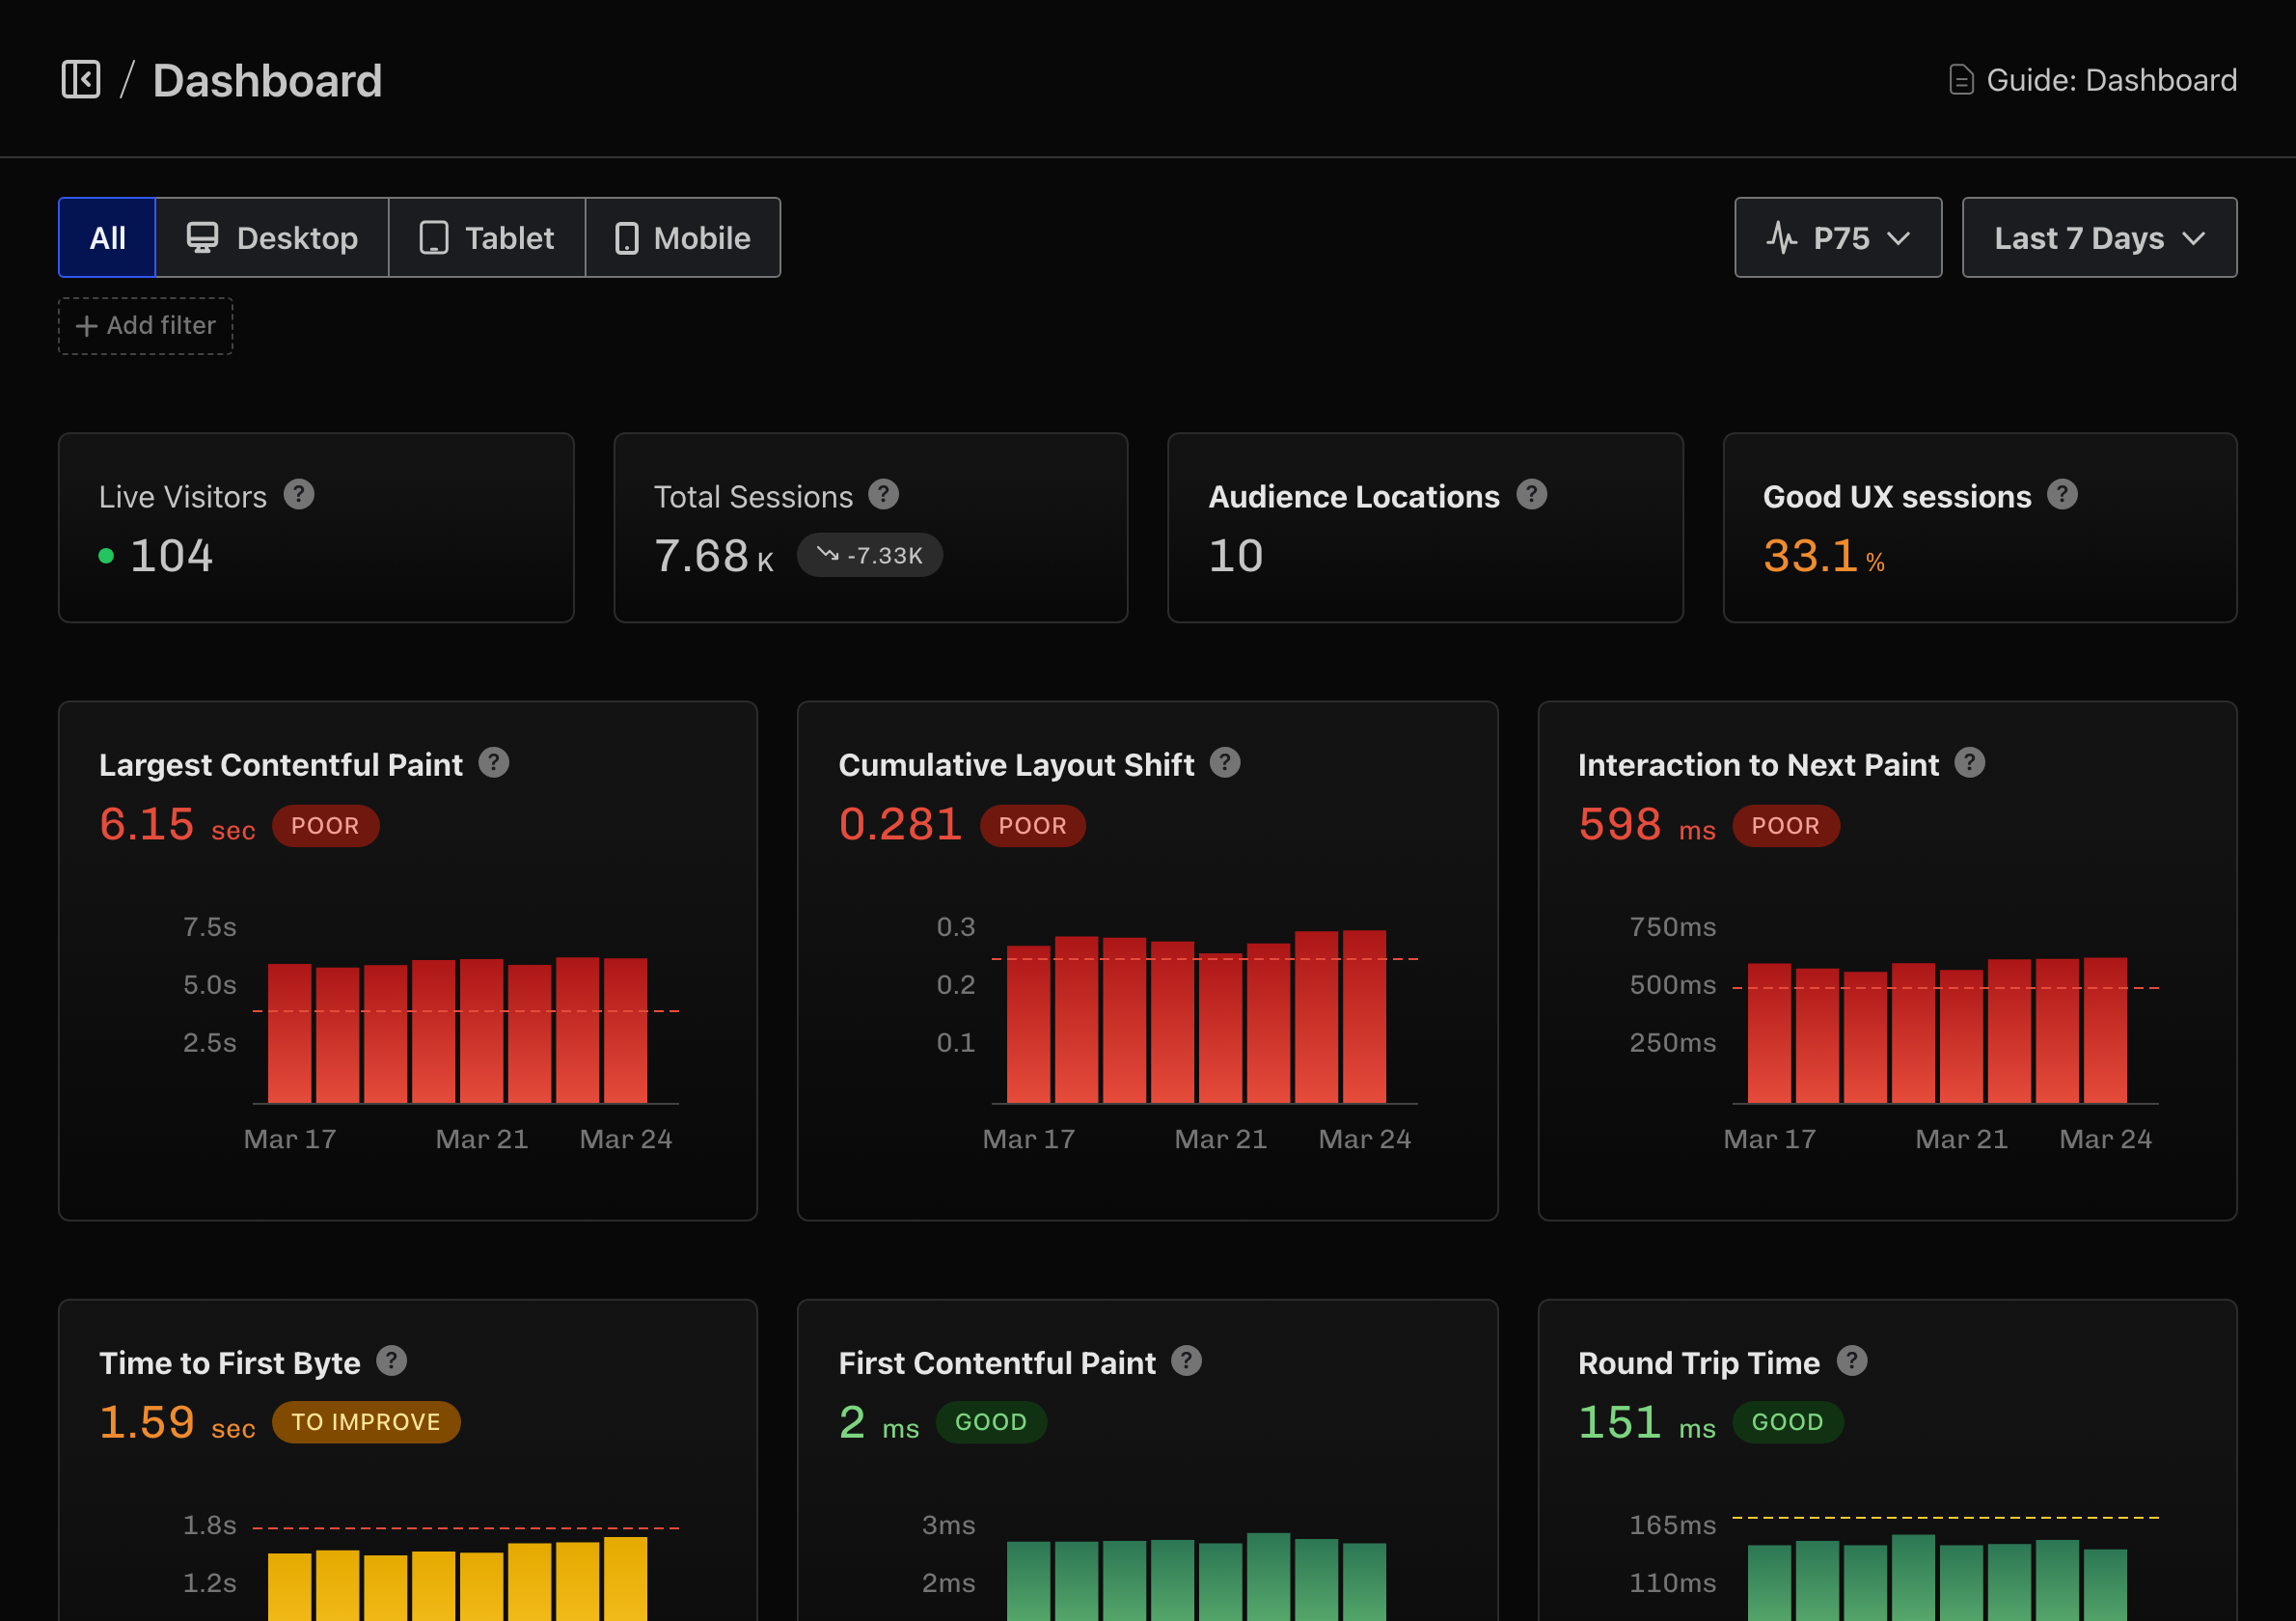
The RUM Dashboard gives you an immediate read on your site’s health. Live visitor counts, total sessions, audience locations, and Core Web Vitals trend charts. Each metric links through to a detailed report, and every filter you set carries across as you navigate.

Pages, ranked by impact#
The Pages Leaderboard ranks every tracked page by traffic volume. Sort by any metric to find the pages with the worst user experience. Group pages by pre-defined URL pattern — /blog/*, /products/*, /checkout/* to see how entire sections of your site perform.
You always know which pages affect the most users, so you know where to focus first.

Element-level attribution#
Calibre doesn’t just report metric scores — it identifies the actual DOM elements dragging them down. Which image causes slow LCP? Which button has the worst INP? Which element triggers layout shifts?
You can add custom attribution with data-name or elementtiming attributes to track the elements you care about most, and filter reports by them.

Audience segmentation#
The Audience Report shows the percentage of visitors who had a good, needs improvement, or poor experience — segmented by country, device type, browser, operating system, and more.
This is how you find problem areas: mobile users in a specific region, a particular browser version, a device you didn’t think to test.

Our approach#
We had clear convictions about what RUM should be. These shaped the product we built:
Focused views, sorted by impact. Every view sets out to quickly tell the story. Everything is sorted by impact, or number of sessions affected.
Privacy-first. No cookies. No personal data. No IP addresses logged or stored. Session identifiers live in sessionStorage and are discarded when the tab closes. The script supports a signature-based subresource integrity attribute to prevent supply-chain tampering. You can optionally exclude EEA/EU visitors entirely.
Lightweight. The RUM script is small, loads after key rendering phases, and avoids heavy instrumentation. It has no meaningful impact on the experience it's measuring.
Predictable pricing. Plans start at 5,000 sessions per month and scale to millions for the largest sites and brands. You control the session sampling rate and data retention period. Whether you sample 15% of sessions or 100%, you know what the cost will be before you enable it.
Get started#
Real User Monitoring is included in all Calibre plans, including the free trial. Installation is a single script tag in your <head>, and you can be collecting data within minutes.
Start a 15-day free trial to try it, or explore RUM on the product page to see more of what it can do.