

React was one of the first major front-end frameworks to not only name, but tout its rendering performance. React’s virtual dom is famous for efficiently rendering components—but what happens when those components suddenly don’t feel fast anymore? Where do you look? How do you fix it?
In this walk-through, we’ll show how to find and fix slow React component code using Chrome developer tools.
While this article is focused on React, you’ll learn concepts that can be applied to React, Angular, Vue or just about anything written in JavaScript. There are three things you’ll need to follow along:
- Use React 16 or newer, in development mode
- Use Google Chrome or Chromium’s devtools (available in all current releases)
- Export JS with source-maps (this is optional, but highly recommended)
Setting up your audit#
Firstly, open Chrome's devtools. You’re going to need some room to breathe, so undock devtools and maximise it to be as large as your screen allows.

When doing performance audits it’s essential that you’re working towards realistic real world device targets. After all, not everyone has a powerful developer computer or current model phone.
Thankfully, Chrome devtools can synthetically throttle JavaScript execution. Throttling JavaScript execution in this manner makes performance issues far more apparent, so it’s a good idea to always debug performance using slowed performance.
Remember: Any improvements that you can make for slow hardware will also mean that fast devices get an even better experience. Everyone wins!

Recording and viewing a performance trace#
In development mode, as React renders, it creates ‘mark and measure’ events for each component. Those marks and measures can be viewed within Devtools.
To record a performance profiler trace, navigate to the page that you’d like to test (on localhost) and press the ‘Start profiling and reload page’ button.
This will record a performance trace for the current page. Chrome automatically stops recording the trace after the page has settled, though you can end it earlier by pressing the stop button.

Once you’ve got a trace, your window will look something like this:
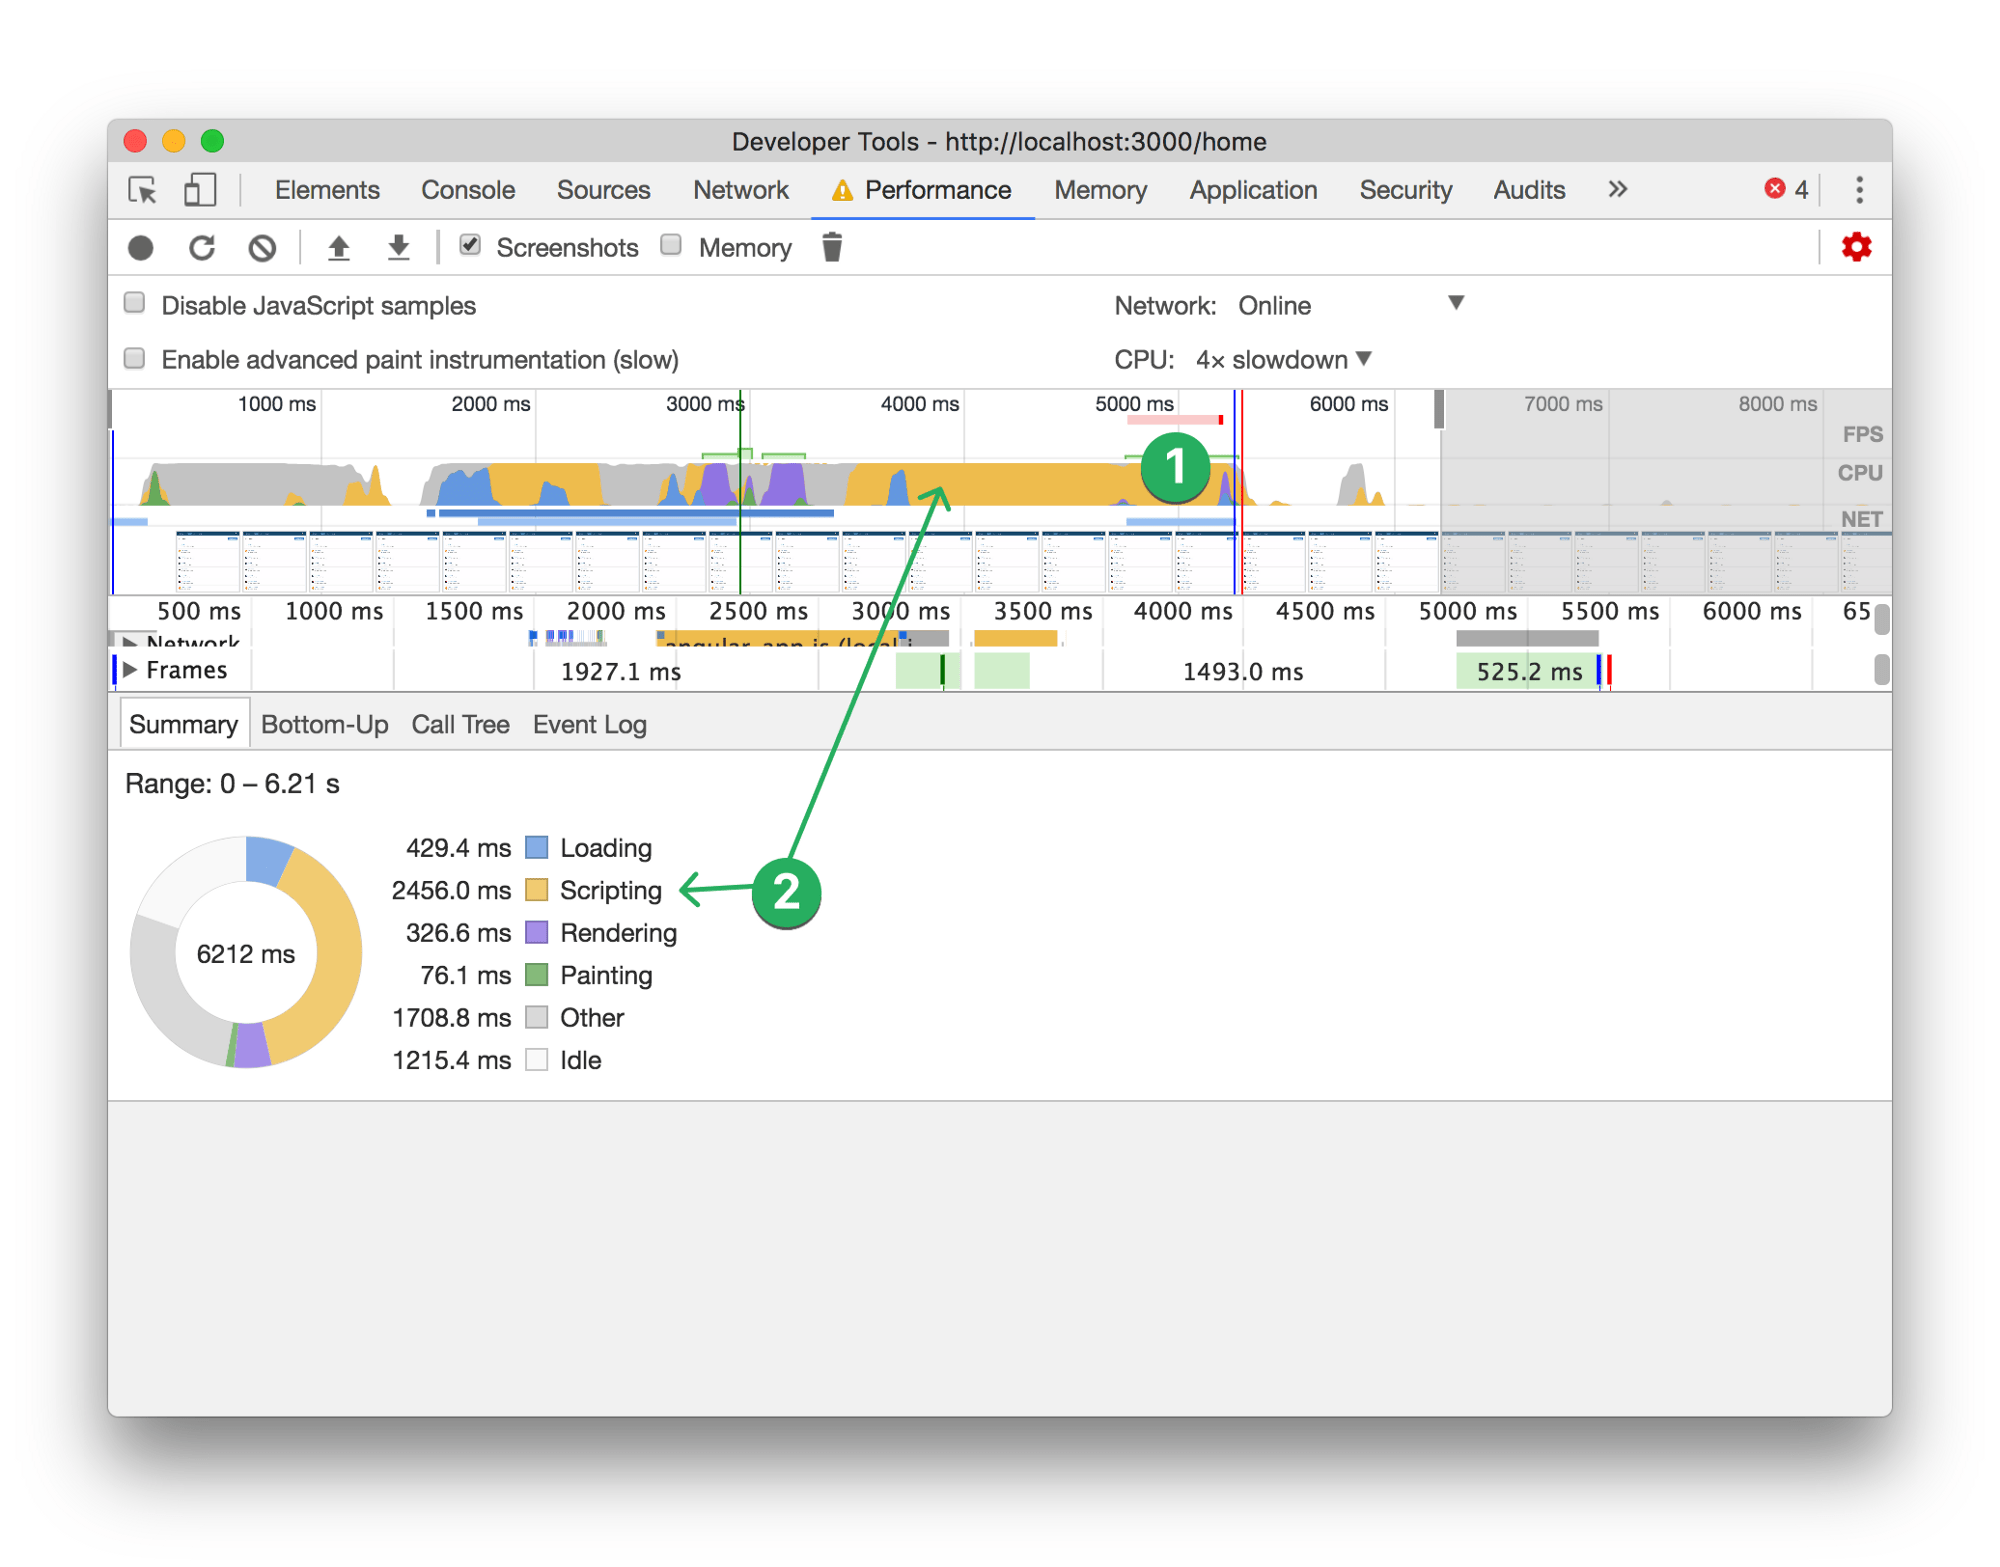
Two items worth highlighting, that may not be immediately obvious to someone who is new to the Performance tab.
This red bar indicator shows that there were significant long tasks around this part of the trace timeline. We probably want to investigate there.
The colours used in the graph at the top of the performance window correspond to different types of activity. Each category has various causes, fixes, and analysis required.
In this article, we’re focusing on “Scripting” (JavaScript runtime performance).

Now we’re going to want to investigate that red CPU-burn area. We can see that the page rendered elements on the page during that period of the trace.

Zooming immediately displays user-timing information and a component labelled Pulse (that takes 500ms to render).
Beneath the Pulse component, there appears to be child components rendering, although the size of those items indicates that they aren’t costing a lot of execution time.
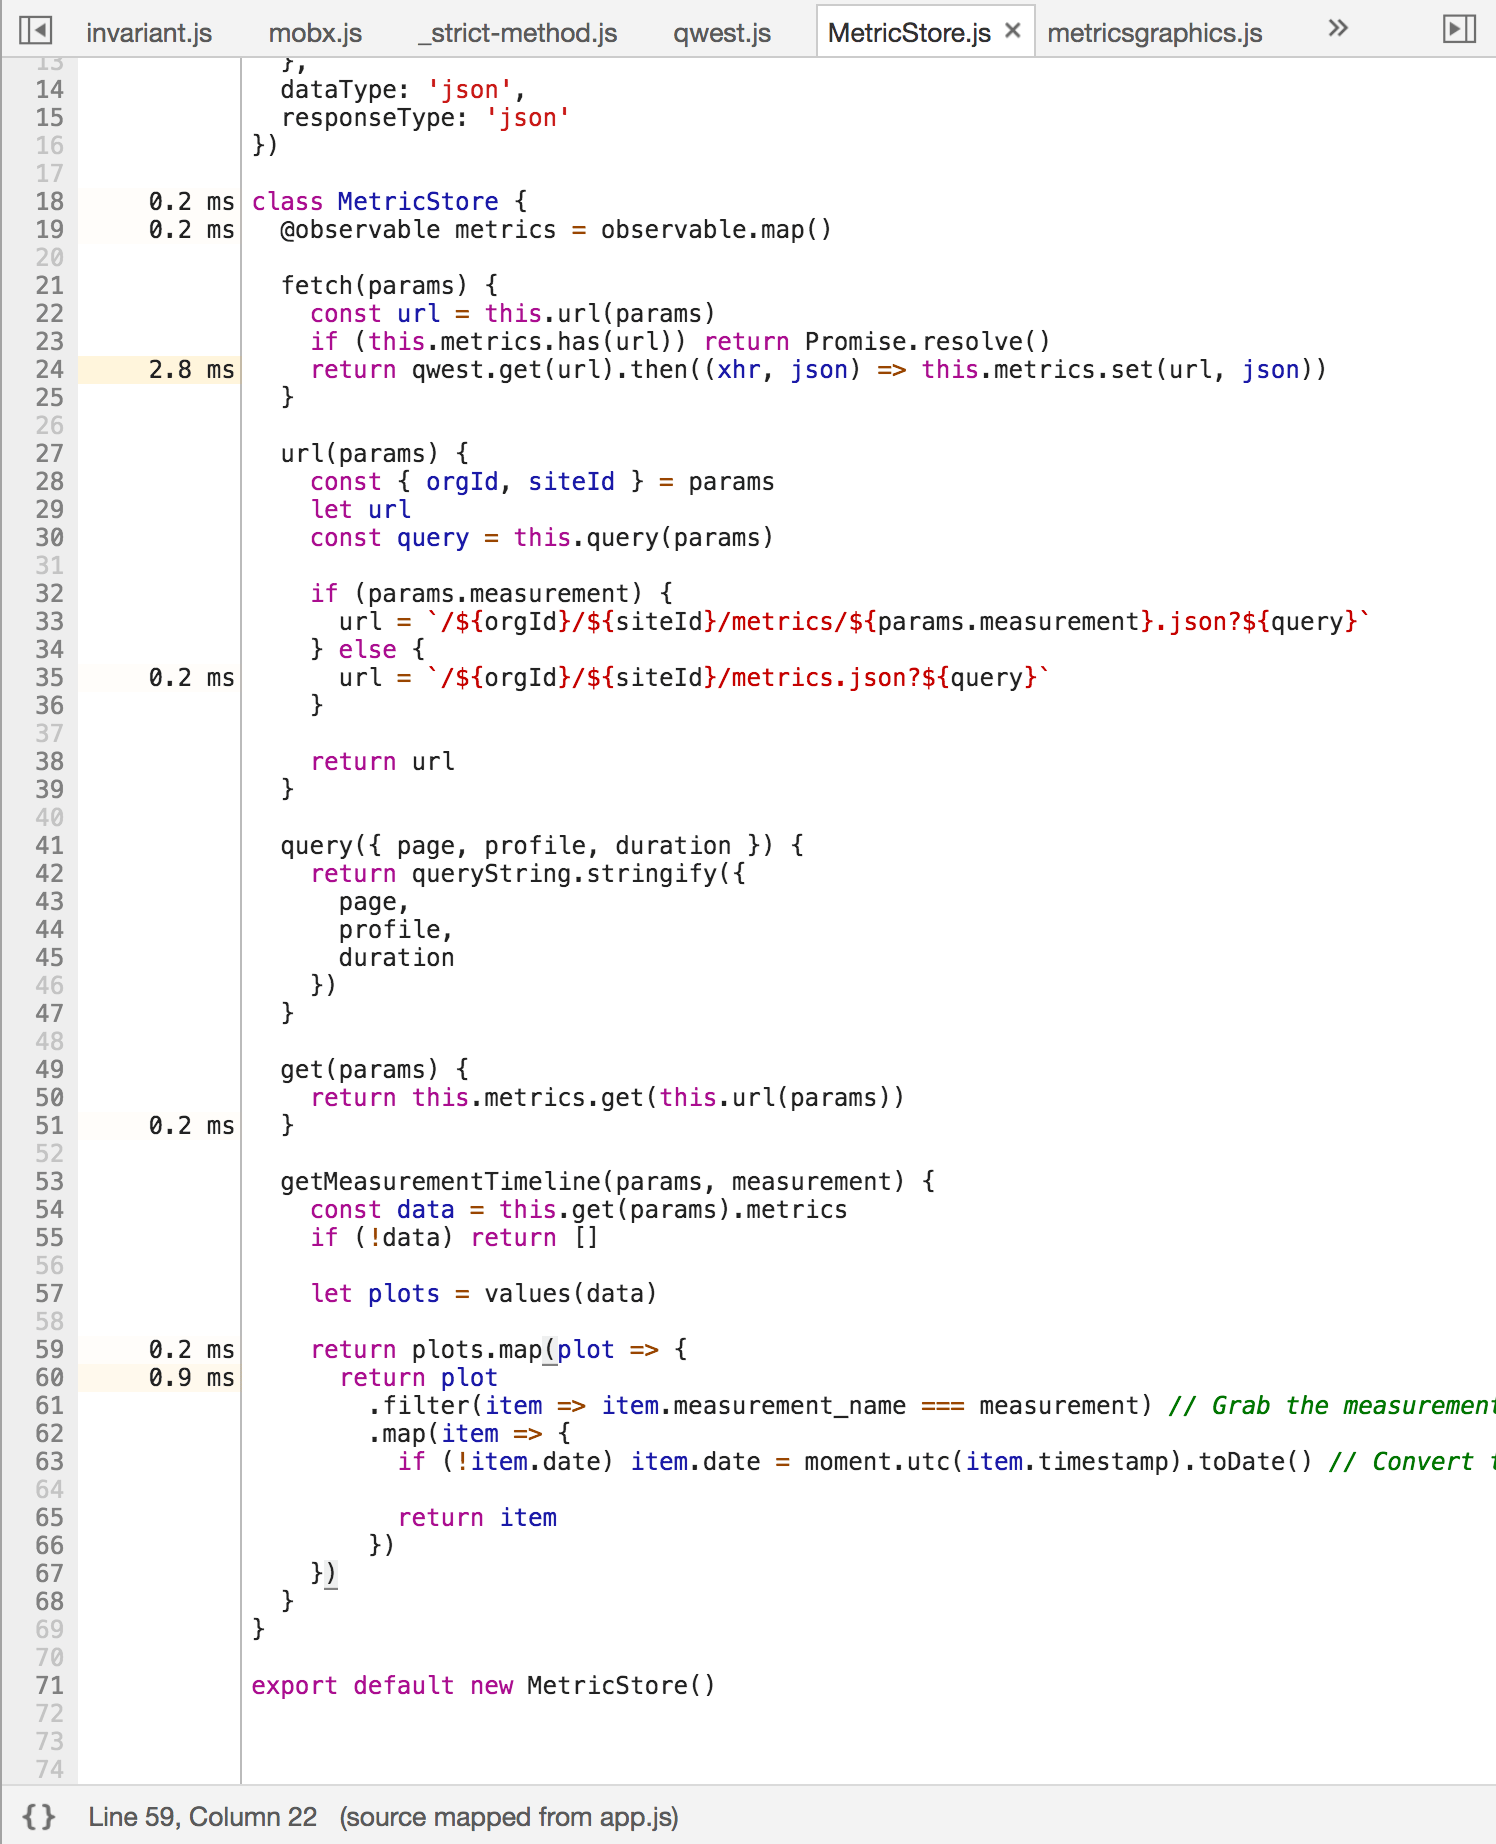
Discovering slow functions#

- Click the component you’d like to investigate, in this case,
Pulse. This scopes the lower portion of the window to focus only on thePulsecomponent. - Choose the “Bottom-Up” tab.
- Sort by total time descending. In some cases, you may want to sort by Self time, or group by something other than the URL. Experiment what works best for what you’re investigating.
- Expand functions until you’ve located a point in the code you’d like to investigate. In this case the
mapfunction appears suspect. It amounts to 90ms of execution time. - This is why you need sourcemaps: Clicking
MetricStore.js:59in the line number gutter will take you to that spot in the code. Let’s go!
Using this approach, I’ve managed to shave seconds from areas of code that I thought “well, it’s complicated, so I guess it takes a while”. Now I know exactly how and where to look for janky JavaScript performance.
Visualising the impact of third party scripts#
Easily investigate which scripts or third parties are costing your customers time using Calibre’s Long Task Timeline explorer
Can I export these metrics or add my own?#
When in development mode, React publishes component runtime metrics to the User Timing API, which is why it’s visible in devtools without any additional browser extensions.
You can use custom User-Timing events to instrument your sites and applications.
Here's a few examples that you may want to consider adding to your projects:
- Webfonts loaded
- Advertisement initialised
- Add item to cart
- Registration page: Time to register
- Cart page: Time to checkout
All major browsers support the User Timing API, so it makes sense to add instrumentation to critial user-actions and flows to gain a deeper insight into the experiences people are having on your pages.
User timings can be delivered to Google Analytics, or to a custom collection endpoint using navigator.sendBeacon().
Being a successful performance-minded developer requires great focus and knowledge. The good news is you’re already half way there! Best of luck!